Nathalia V. M. de Oliveira
An Analytics project utilizing housing market data sourced from the Dutch website Funda.
Funda Property Listings Data Analysis
Nathalia V. M. de Oliveira - April, 2024.
Analysis of the Dutch Housing Market
This project analyzes the Dutch housing market based on property listings available on the Funda.nl website. The objective is:
- Provide an overview of the housing market in the Netherlands through online property listed on the Funda.nl website;
- Generate insights into the most valuable or cost-effective locations among provinces and cities;
- Examine the profile of houses and the distribution of their most common features;
- Identify factors that may contribute to the variation in property prices.
The process involves data extraction via web scraping, data transformation for cleaning and preparation, and exploratory analysis through interactive visualizations in Power BI. The result is a set of dashboards offering detailed insights into geographic distribution, property characteristics, and price and size statistics by province and city.
If you are NOT interested in the technical part, you can go straight to the Results.
Data Source
Funda is a Dutch residential platform established since more than 20 years ago. According to their website, Funda is the largest platform connecting supply and demand in the real estate market of the Netherlands, with over 4 million unique visitors per month and hosting around 97% of the Dutch housing market.
According Funda’s Terms and Conditions, scraping its website is only allowed for personal use.
Extraction - Collecting the Data
The data were scraped from Funda using FundaScraper module for Python. Before running it, there are several different sets of arguments that can generate diverse searches. For this project, the following arguments have been used:
area=provincie
want_to=buy
find_past=False
page_start=1
n_pages = 50
raw_data=True
- area=provincie: To fetch data by province. You can also search for city, neighborhood, or postcode.
- want_to=buy: Regarding properties for sale. You can switch to “rent”.
- find_past=False: Regarding properties available at the moment, not already sold
- n_pages = 50: Number of pages to be fetched. A certain number of pages I found is safe to record partially, to avoid loss in case of execution failure.
- raw_data=True: To fetch the data without any preprocessing. I decided to do all the preprocessing myself. However, it’s possible to set the argument to False to receive beautifully processed and structured data.
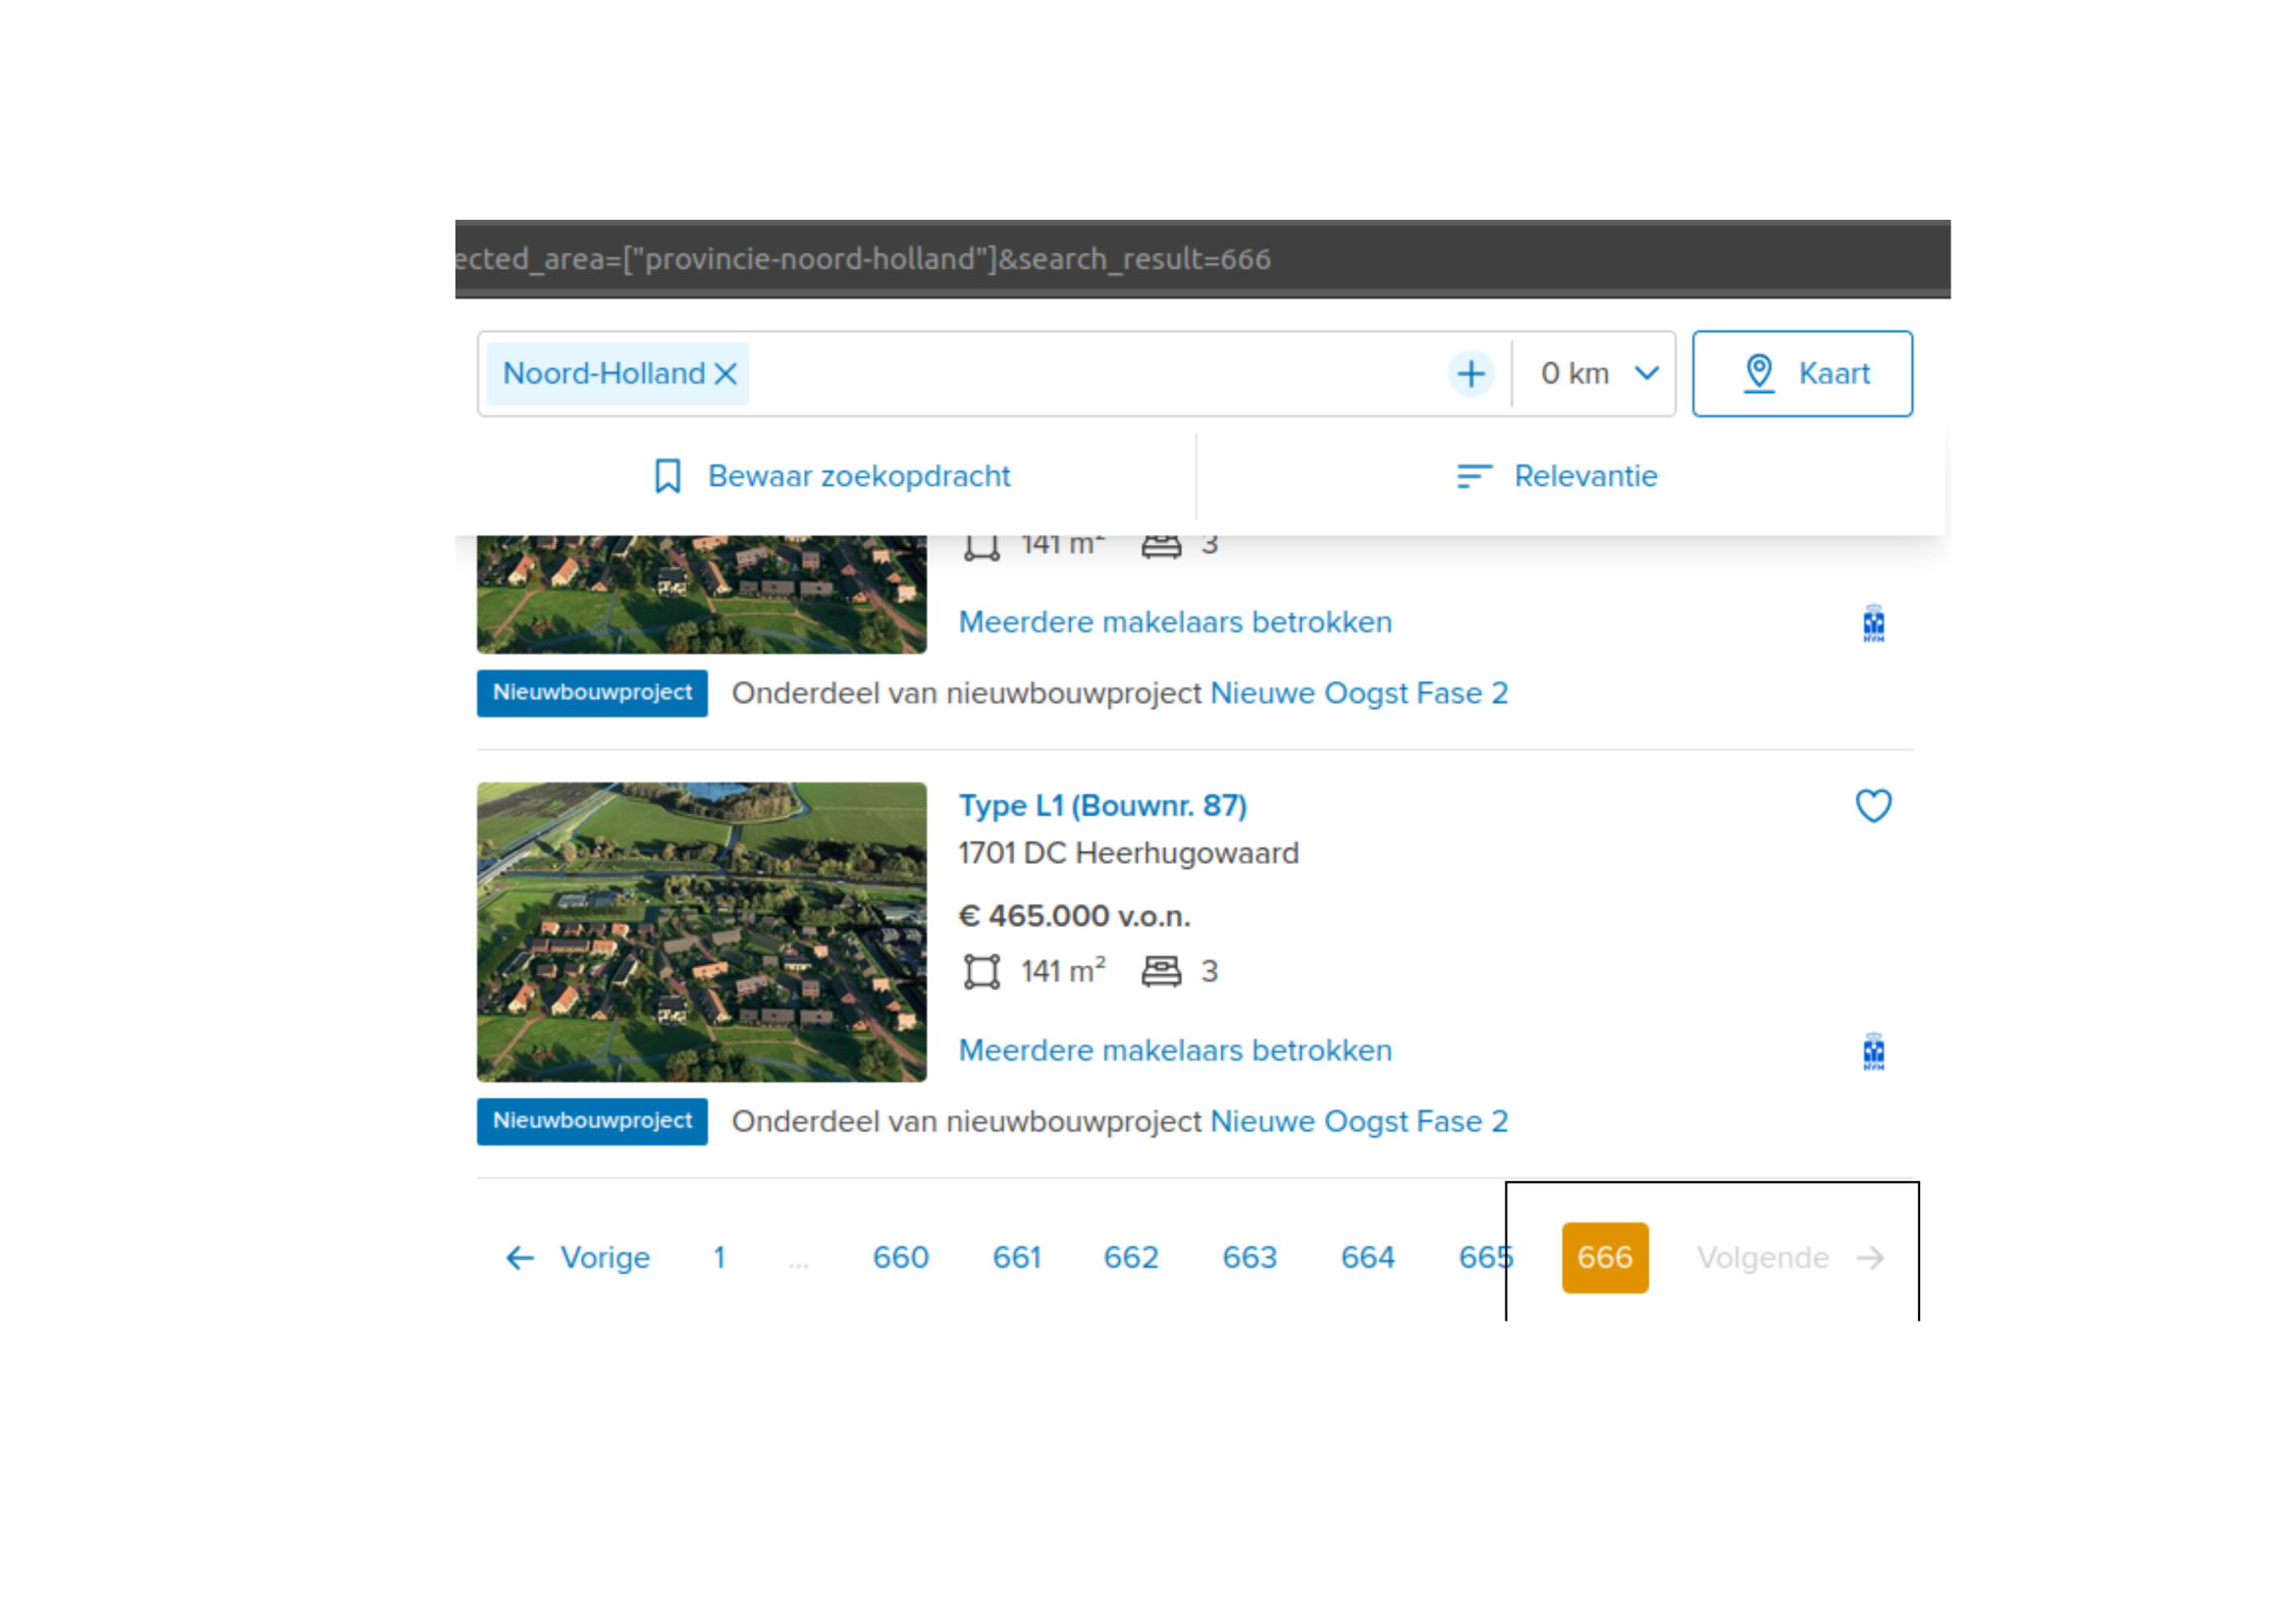
Although searching by province may return, for instance, 12,000 results, Funda only makes a maximum of 666 pages accessible, as shown below. This equates to 9,990 entries, as each page contains 15 listings.
You can have a preview of this search by province results here.
Then, every 50 pages (or 750 entries), the script scrapes and records the data into a CSV regarding each province.
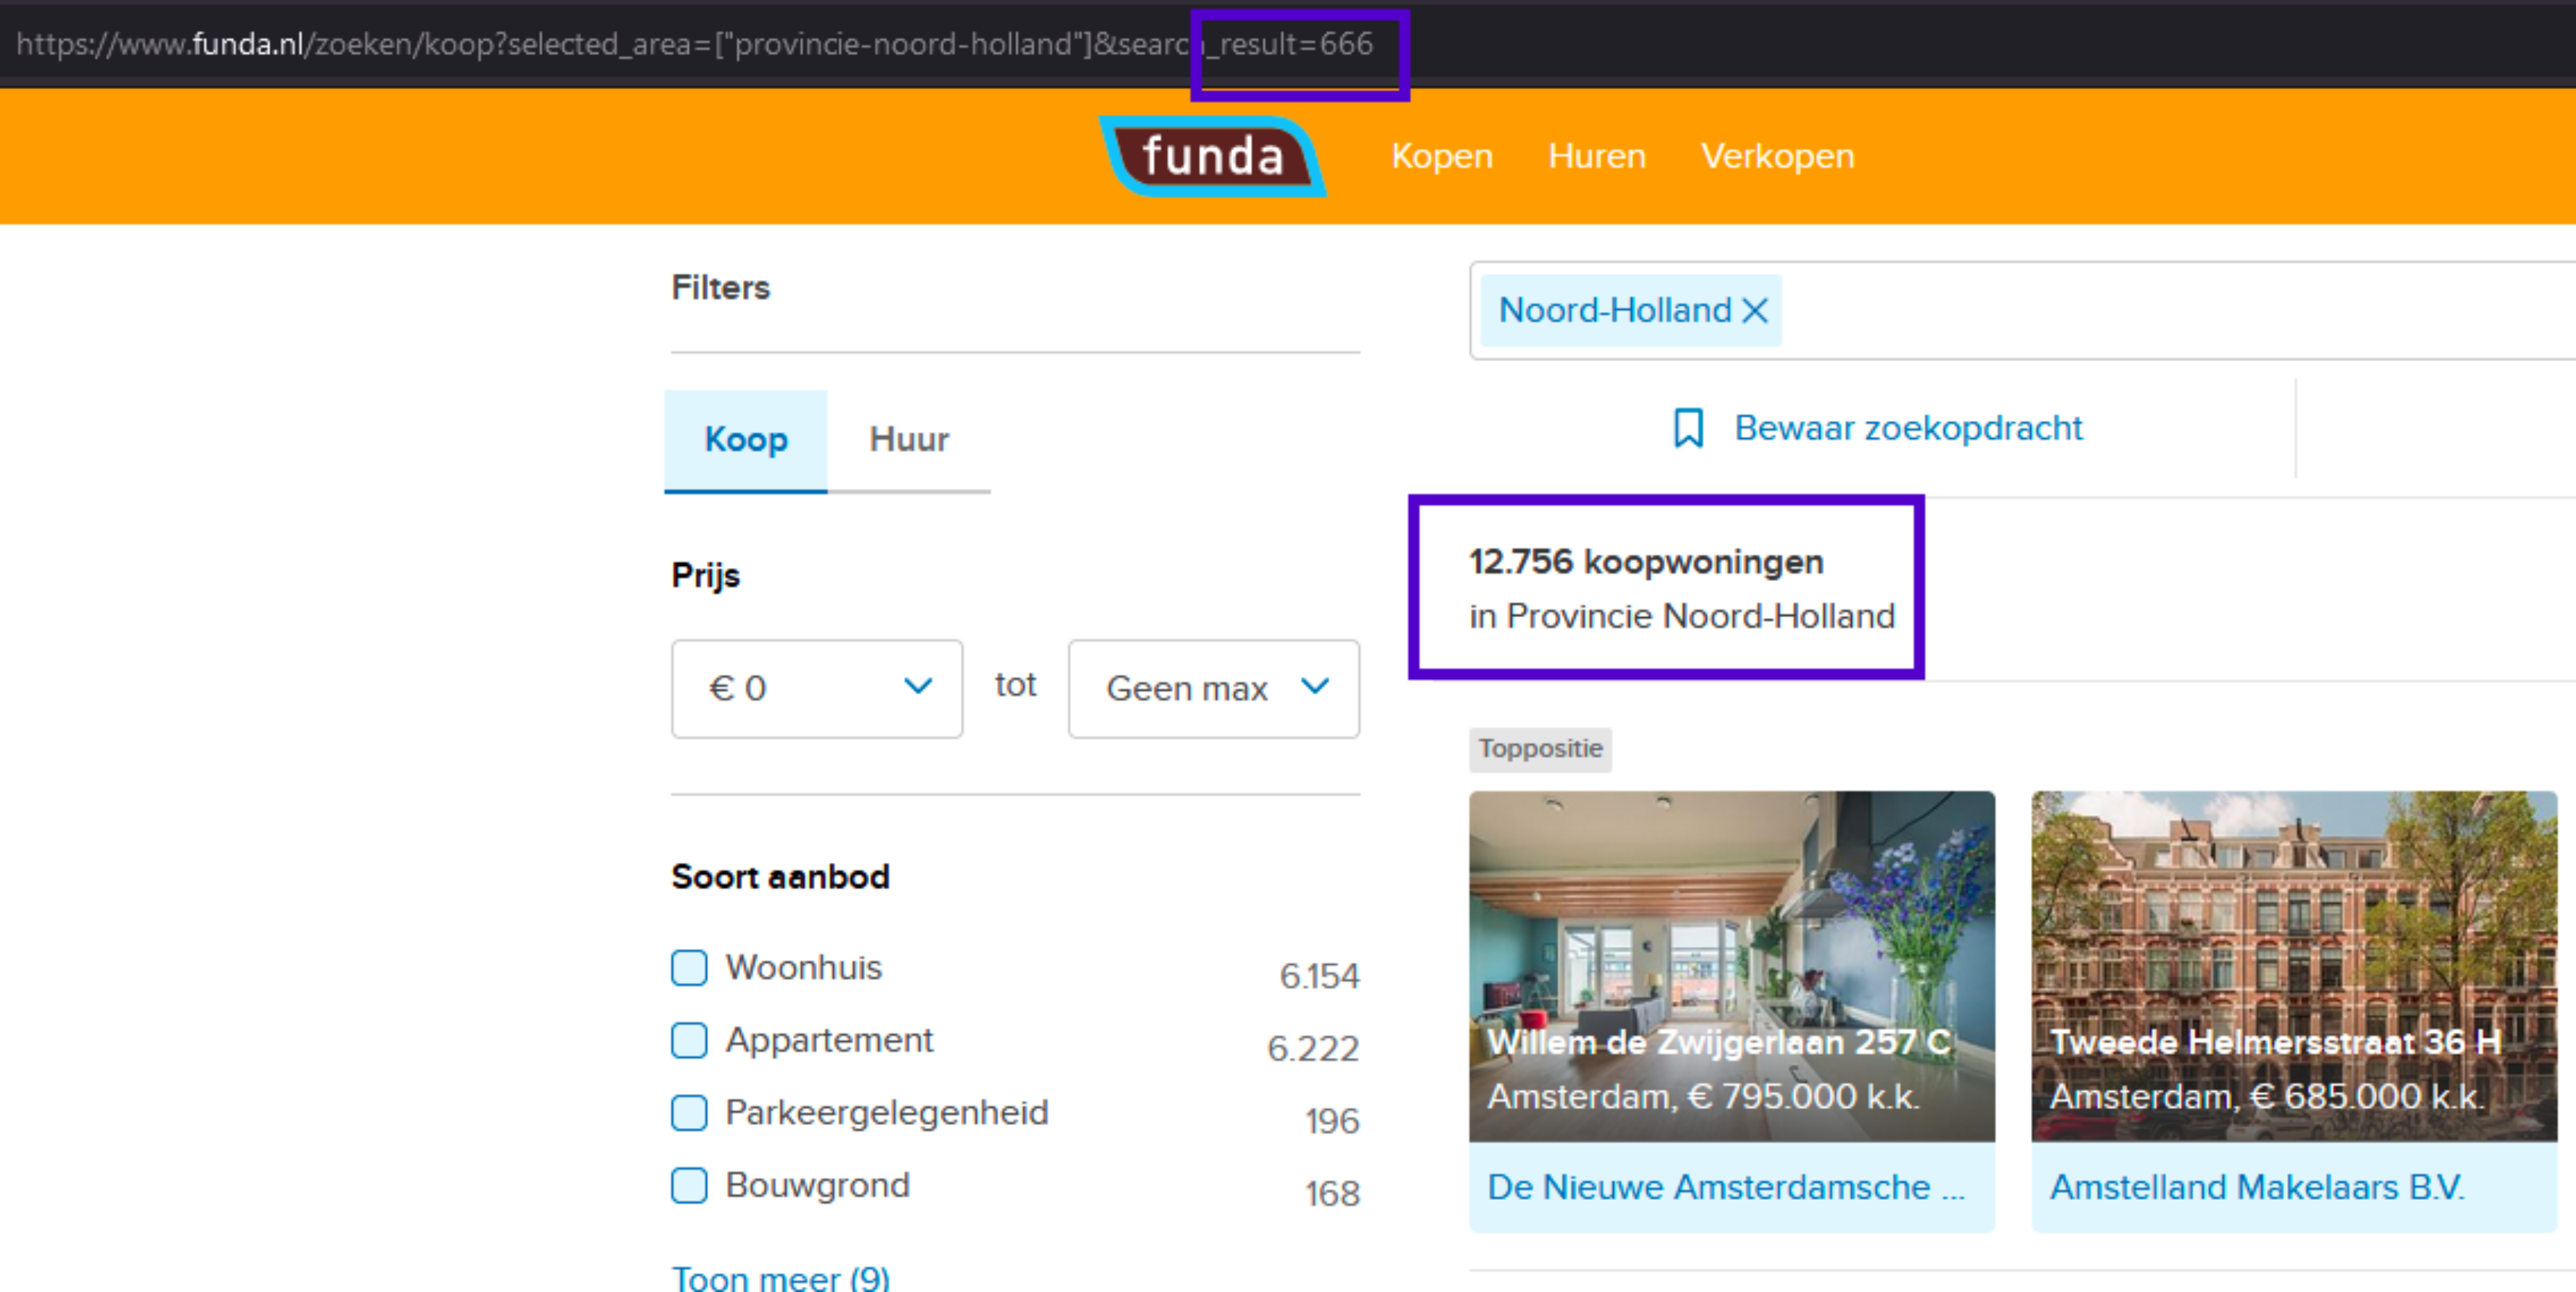
The pictures show there are no next pages.
Data Overview
The data were collected on the 10th of April, 2024, which means that the dataset for this case study includes all the housing property listings available for sale during that period.
The raw scraped dataset contains the following columns:
- url
- price
- address
- description
- listed_since
- zip_code
- size
- year_built
- living_area
- kind_of_house
- building_type
- num_of_rooms
- num_of_bathrooms
- layout
- energy_label
- insulation
- heating
- ownership
- exteriors
- parking
- neighborhood_name
- date_list
- date_sold
- term
- price_sold
- last_ask_price
- last_ask_price_m2
- city
The raw data look like expected, a little mess.
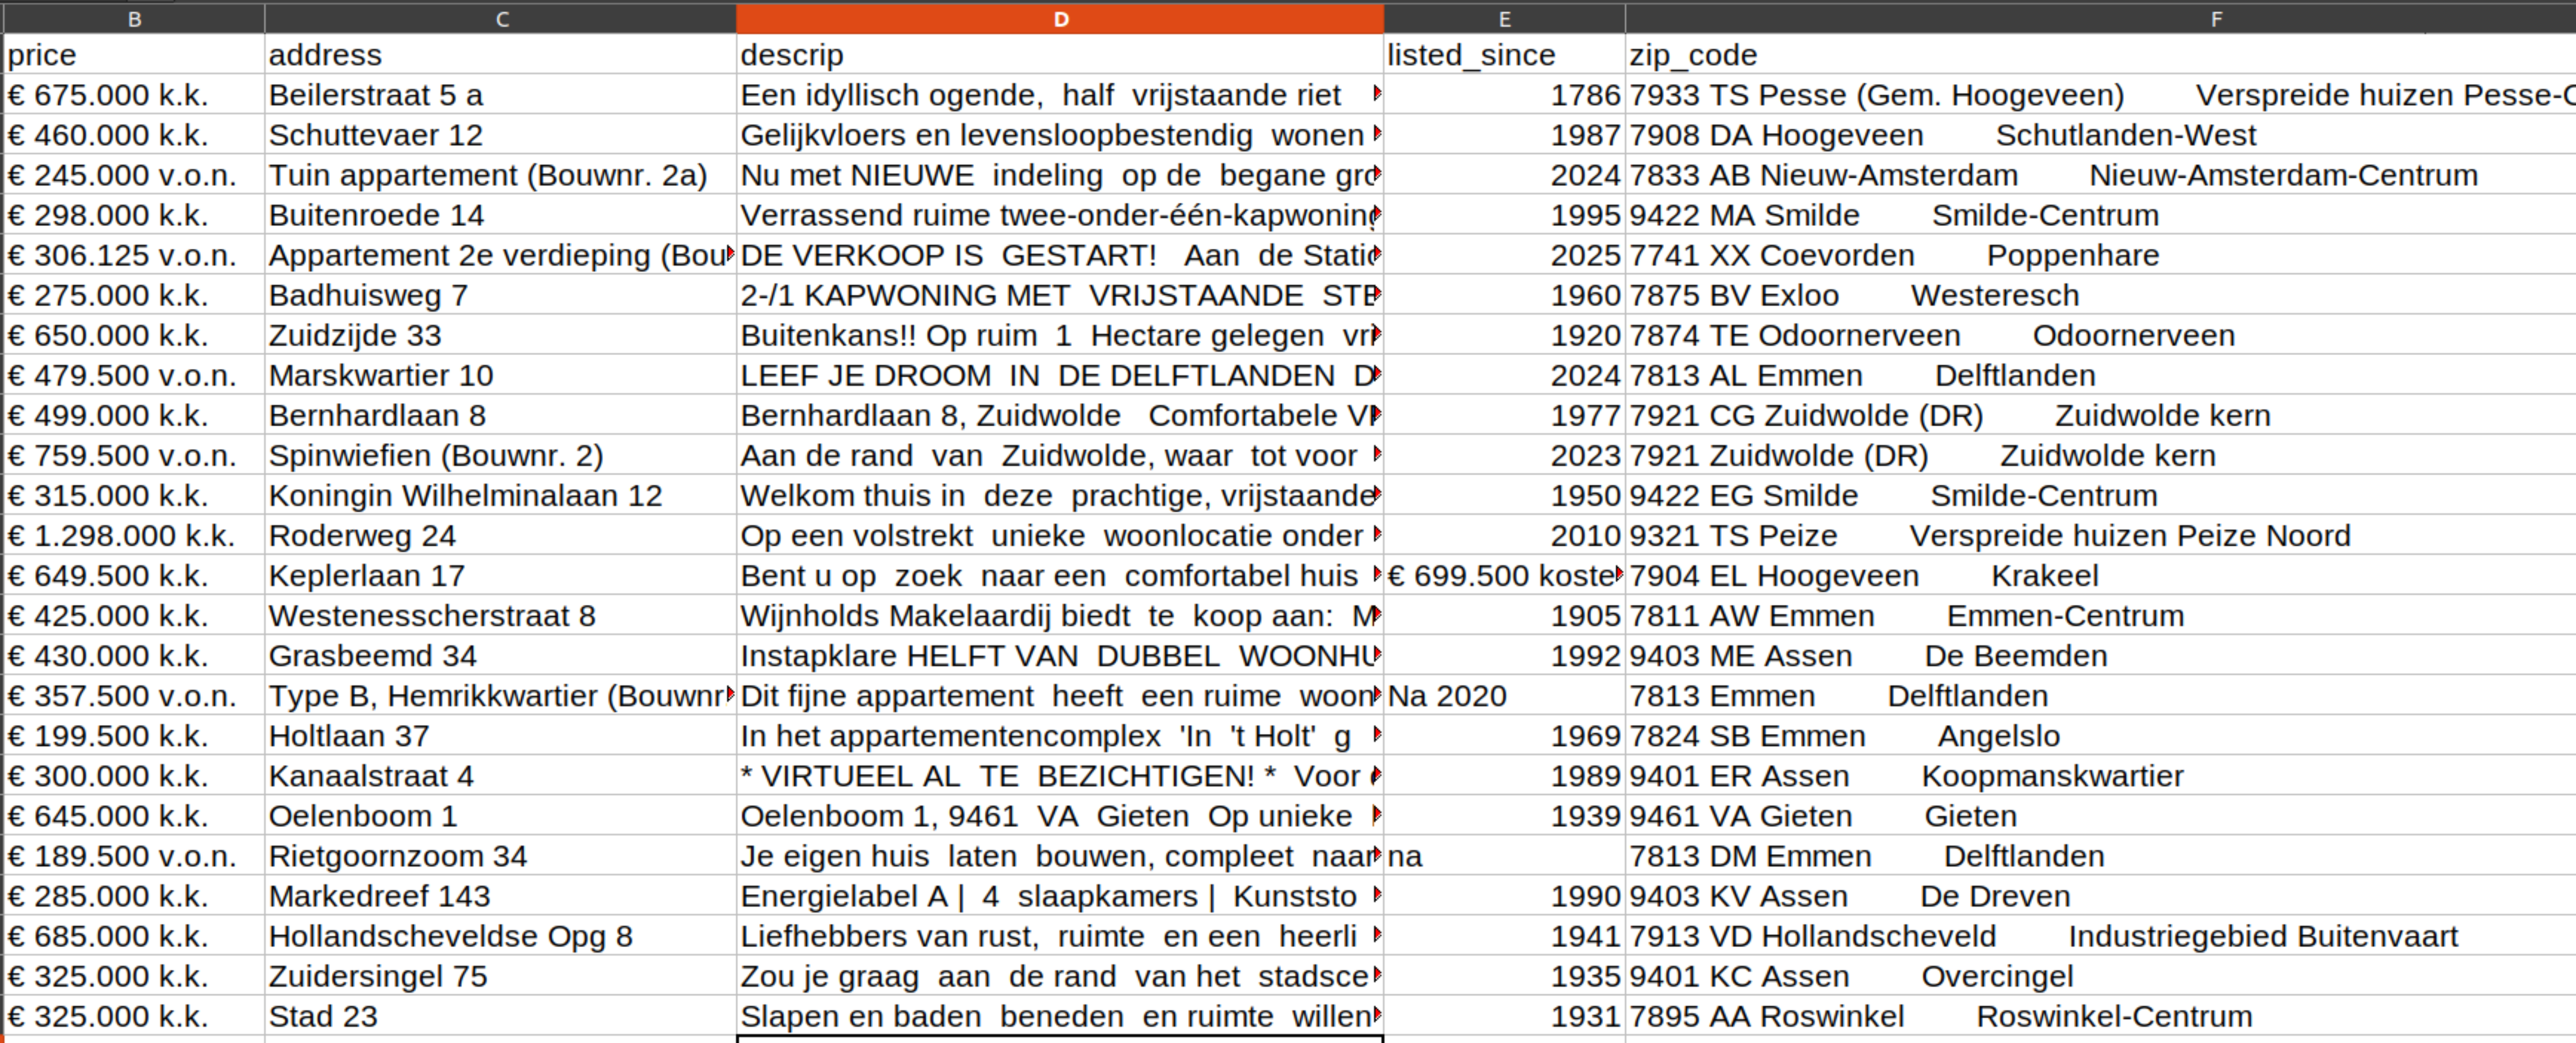
You can also take a look at the whole table. It’s possible to see that it is going to take a lot of work.
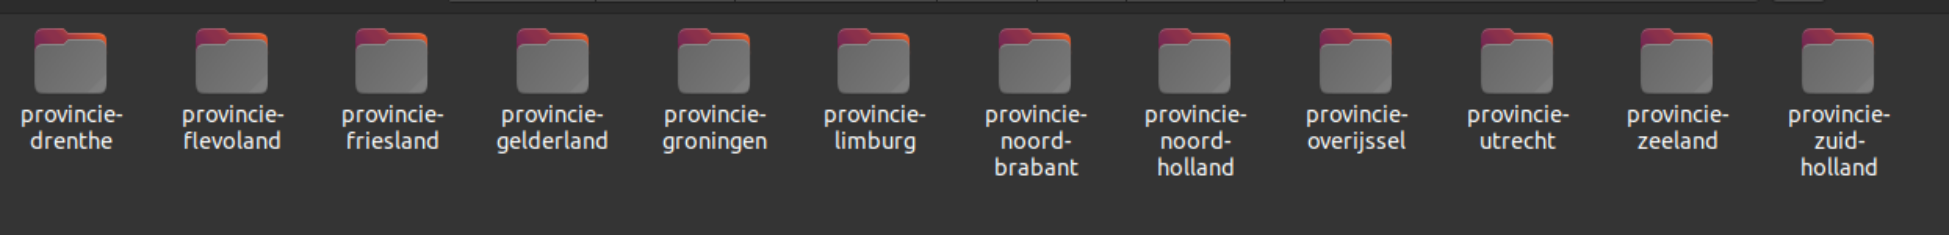
And so, the following provinces CSV files were generated. The number corresponds to the quantity of listings returned:
Drenthe - 1912
Groningen - 1946
Flevoland - 2161
Friesland - 2280
Zeeland - 3033
Limburg - 4095
Utrecht - 4146
Overijssel - 4305
Gelderland - 7410
Zuid Holland - 9990
Noord Brabant - 10004
Noord Holland - 10004
For some reason, Noord Holland and Noord Brabant have more than 9990 listings. I assumed they could be duplicates and would be treated accordingly during the processing step.
The raw dataset then starts with 61,286 entries and 1.1 GB in size.
Transformation - Processing the Data
On the transformation step, when running the data processing script, several processes were applied to the data so that could be better suited for analytics.
At first, the script loads raw data from each province CSV file,
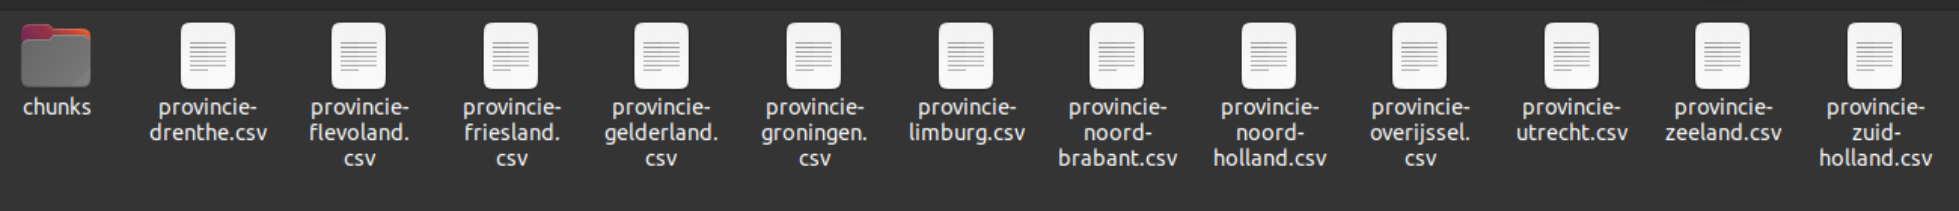
and creates them specified folders in a general chunk folder, in which the processed data will be written after the cleansing.
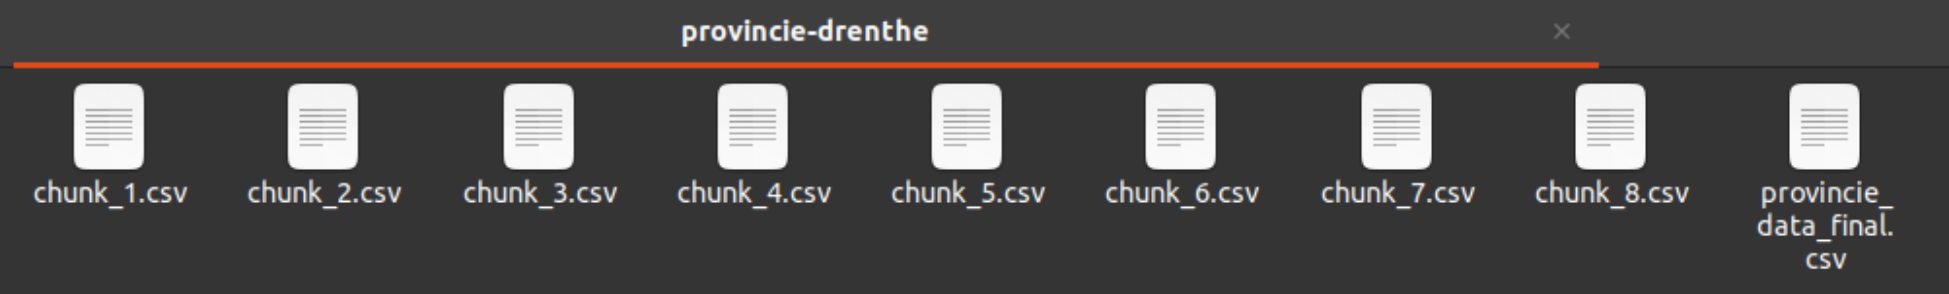
Using chunks
The processing step ended up heavy and a bit slow. There was a need to adopt a measure to maintain the already processed data and avoid losses due to frequent interruptions in execution caused by unexpected occurrences. In order to breaking down the dataset into smaller and more manageable pieces, the cleaning and writing process for each province was then partitioned into chunks of 300 instances and executed in a loop.
Transformation part I
Process all perfomed using Pandas.
General Data Cleansing:
- Removes rows with missing values in essential columns. Those whose absence would make most analyses impossible, for instance, address or price columns. Other blank data were accepted and left blank, as they are assumed to be Missing Completely at Random (MCAR).
- Deduplication by comparing identical records and also identical addresses.
- Dropping columns that won’t be used later due of the scope of the project. For instance,
'photo', 'descrip', 'log_id', 'insulation', 'ownership'and other that can be seen at Data processing script.
Specific features cleansing:
- Size (size_m2): Removes unwanted characters, converts to numeric type, and renames the column.
- For exemple, from string
'226 m²'to number226. - Price (price): Removes unwanted characters and converts to numeric type.
- For exemple, from string
'€ 1.190.000 k.k.'to number1190000. - Price per square meter (price_m2): Calculates the price per square meter (m²).
- Year built (year_built): Extracts the year from text and converts to numeric type.
- For exemple, from
1960-1970 Na 2020 Voor 1906 2025toYYYY. - House age (house_age): By derivation, calculates the age of the house relative to the current year.
- Energy label (energy_label): Extracts the relevant part of the energy label.
- For exemple, from
  D
  F
  A+
  A+++
  A+++
  A++++
  C
  A  0,78
  na
  C
to
A, B, C, D, E, F, G and agregating all A greater than A+ into A+. - Heating (heating): Extracts patterns from text, categorizes the heating type, and translated to english. For exemple, from
      Cv-ketel, gashaard en gedeeltelijke vloerverwarming
      Cv-ketel en gedeeltelijke vloerverwarming
      Gehele vloerverwarming, warmte terugwininstallatie en warmtepomp
      Gaskachels
      Gehele vloerverwarming en warmtepomp
      Cv-ketel en pelletkachel
      Open haard, gedeeltelijke vloerverwarming en warmtepomp
      Cv-ketel
      Blokverwarming
to
boiler boiler heat pump gas heaters heat pump boiler heat pump boiler block heating - Parking (has_parking): Determines if the property has its own parking spot based on the text description. Public or paid spots are given as ‘no’.
- For exemple, from
  Soort garageVrijstaande houten garageCapaciteit2 auto'sVoorzieningenElektrische deur en elektra
  Soort garageAangebouwde stenen garageCapaciteit3 auto'sVoorzieningenElektraIsolatieGeen isolatie
  Soort parkeergelegenheidOp eigen terrein en openbaar parkeren
  Soort garageCarport, garage met carport en vrijstaande stenen garageCapaciteit4 auto'sVoorzieningenElektrische deur, vliering, elektra, verwarming en stromend waterIsolatieDakisolatie en muurisolatie
to
'yes' or 'no'. - Exteriors (has_balcony, has_garden, surrounding): Identifies if the property has a balcony and garden, and categorizes the surrounding environment by extracting patterns from text.
-
House type (house_type), House ID (house_id) : Extracts from the URLs. For exemple
https://www.funda.nl/detail/koop/utrecht/huis-jeanne-d-arcdreef-11/89977384/
- Listing date (date_list), Province (provincie): Extracts information by requesting the head section of web pages.
- Layout (num_of_floors, located_floor, num_of_rooms, num_of_bedrooms, num_of_bathrooms, num_of_toilets): Extracts data from keywords contained in the ‘layout’ textual column and cleans the associated values.
- Addresses and Zip codes: Cleans addresses, extracts complete zip codes, and obtains geolocation (geographical coordinates) by using Geopy module.
Concatenating chunks and files
Finally, a third script was used to concatenate the chunks of each province into a file per province and then, concatenates all the province files into a single CSV file.
The final processed file contains 53,931 entries and 18,7 MB in size.
Exploratory Data Analysis (EDA) and Visualization
The exploratory data analysis, as well as the visualizations, were built using Power BI, in order to understand the data distribution, patterns, relationships and generate insights. It comprises the phases bellow:
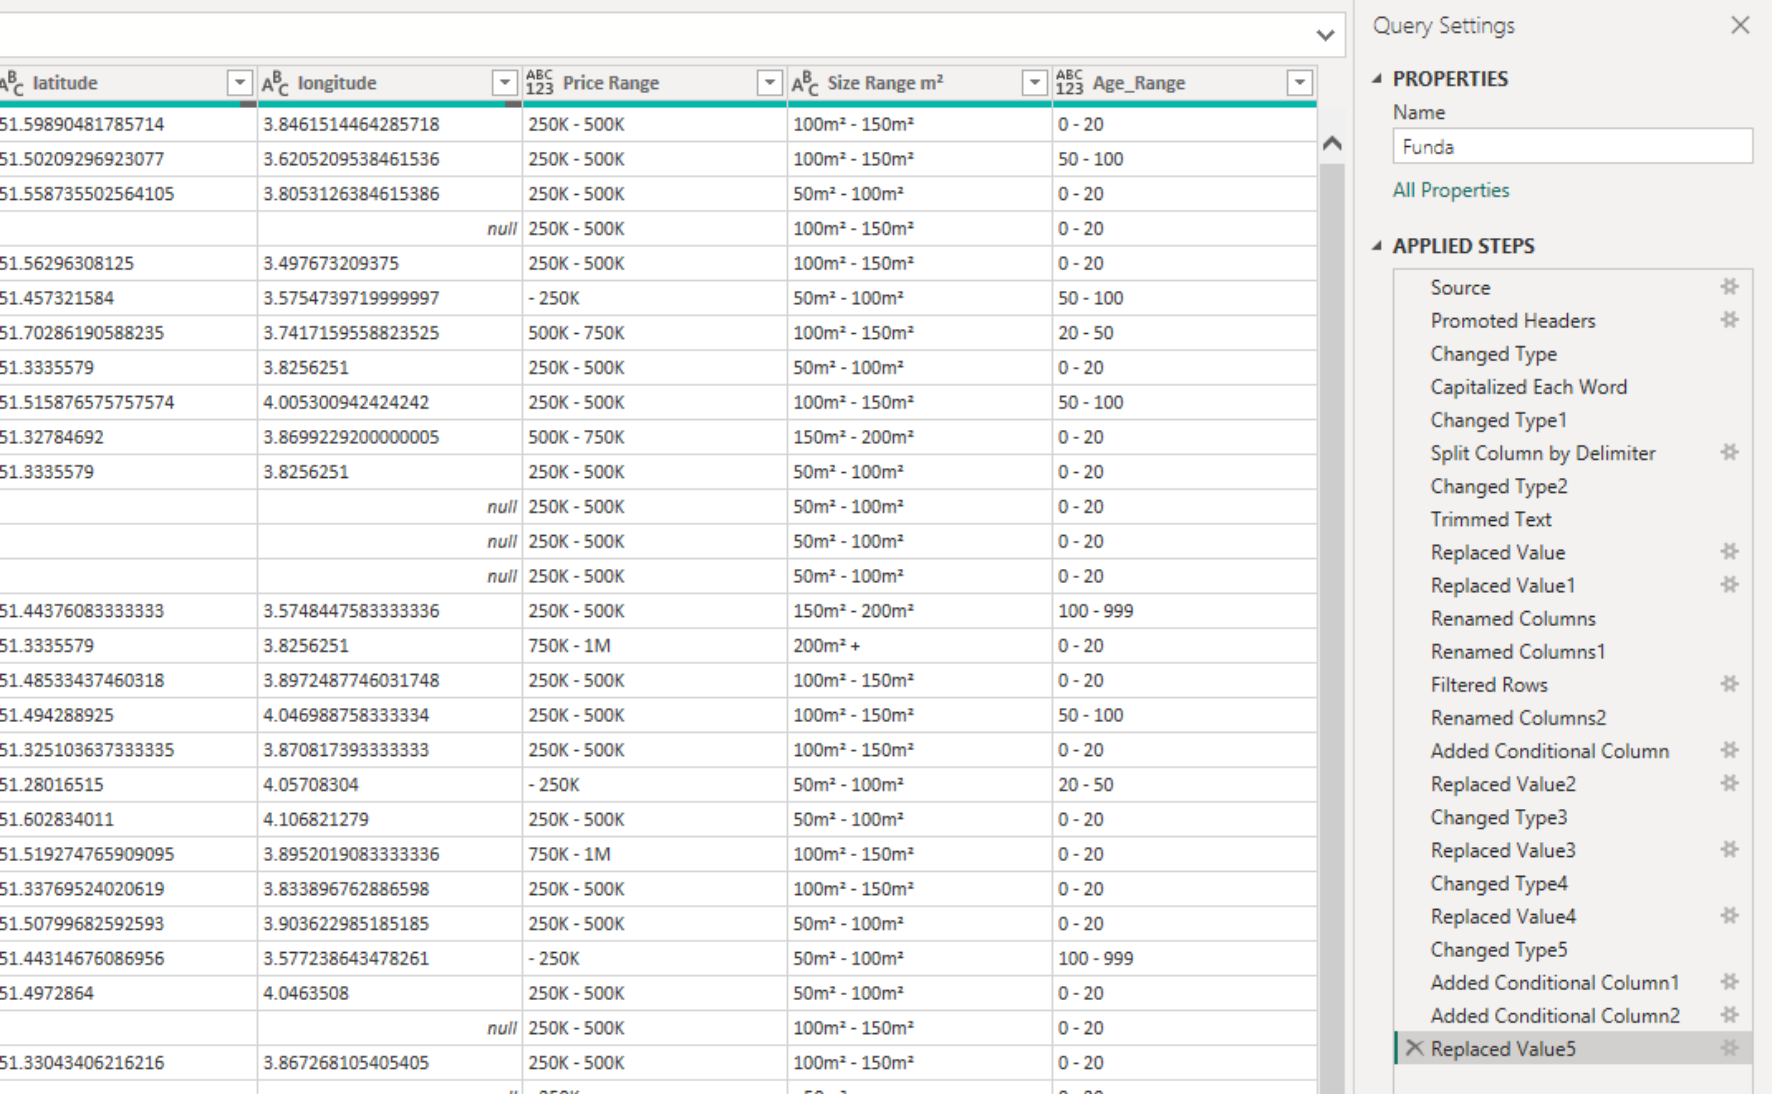
Transformation part 2 - Power BI
The processed data CSV file is loaded, and techniques such as type adjustment, column splitting and renaming, and creating columns with value ranges are applied in the Power Query editor.
Outliers
For outlier detection, the Z-score method was applied on the property prices and prices per m². Results greater than 3 were considered outliers, which in the dataset reflect prices from €1,900,000 and €4,299.06 per m². Then,
- 782 property prices were considered outliers, while 53,117 were considered normal.
- x property prices per m² were considered outliers, while y were considered normal.
Modeling
At this stage, a new data source has been also incorporated: a table with some of the largest and main cities in the Netherlands along with their respective populations, which will be used in related analyses. Thus, the “Funda” and “LargestCities” tables received a relationship through the common column “city”.
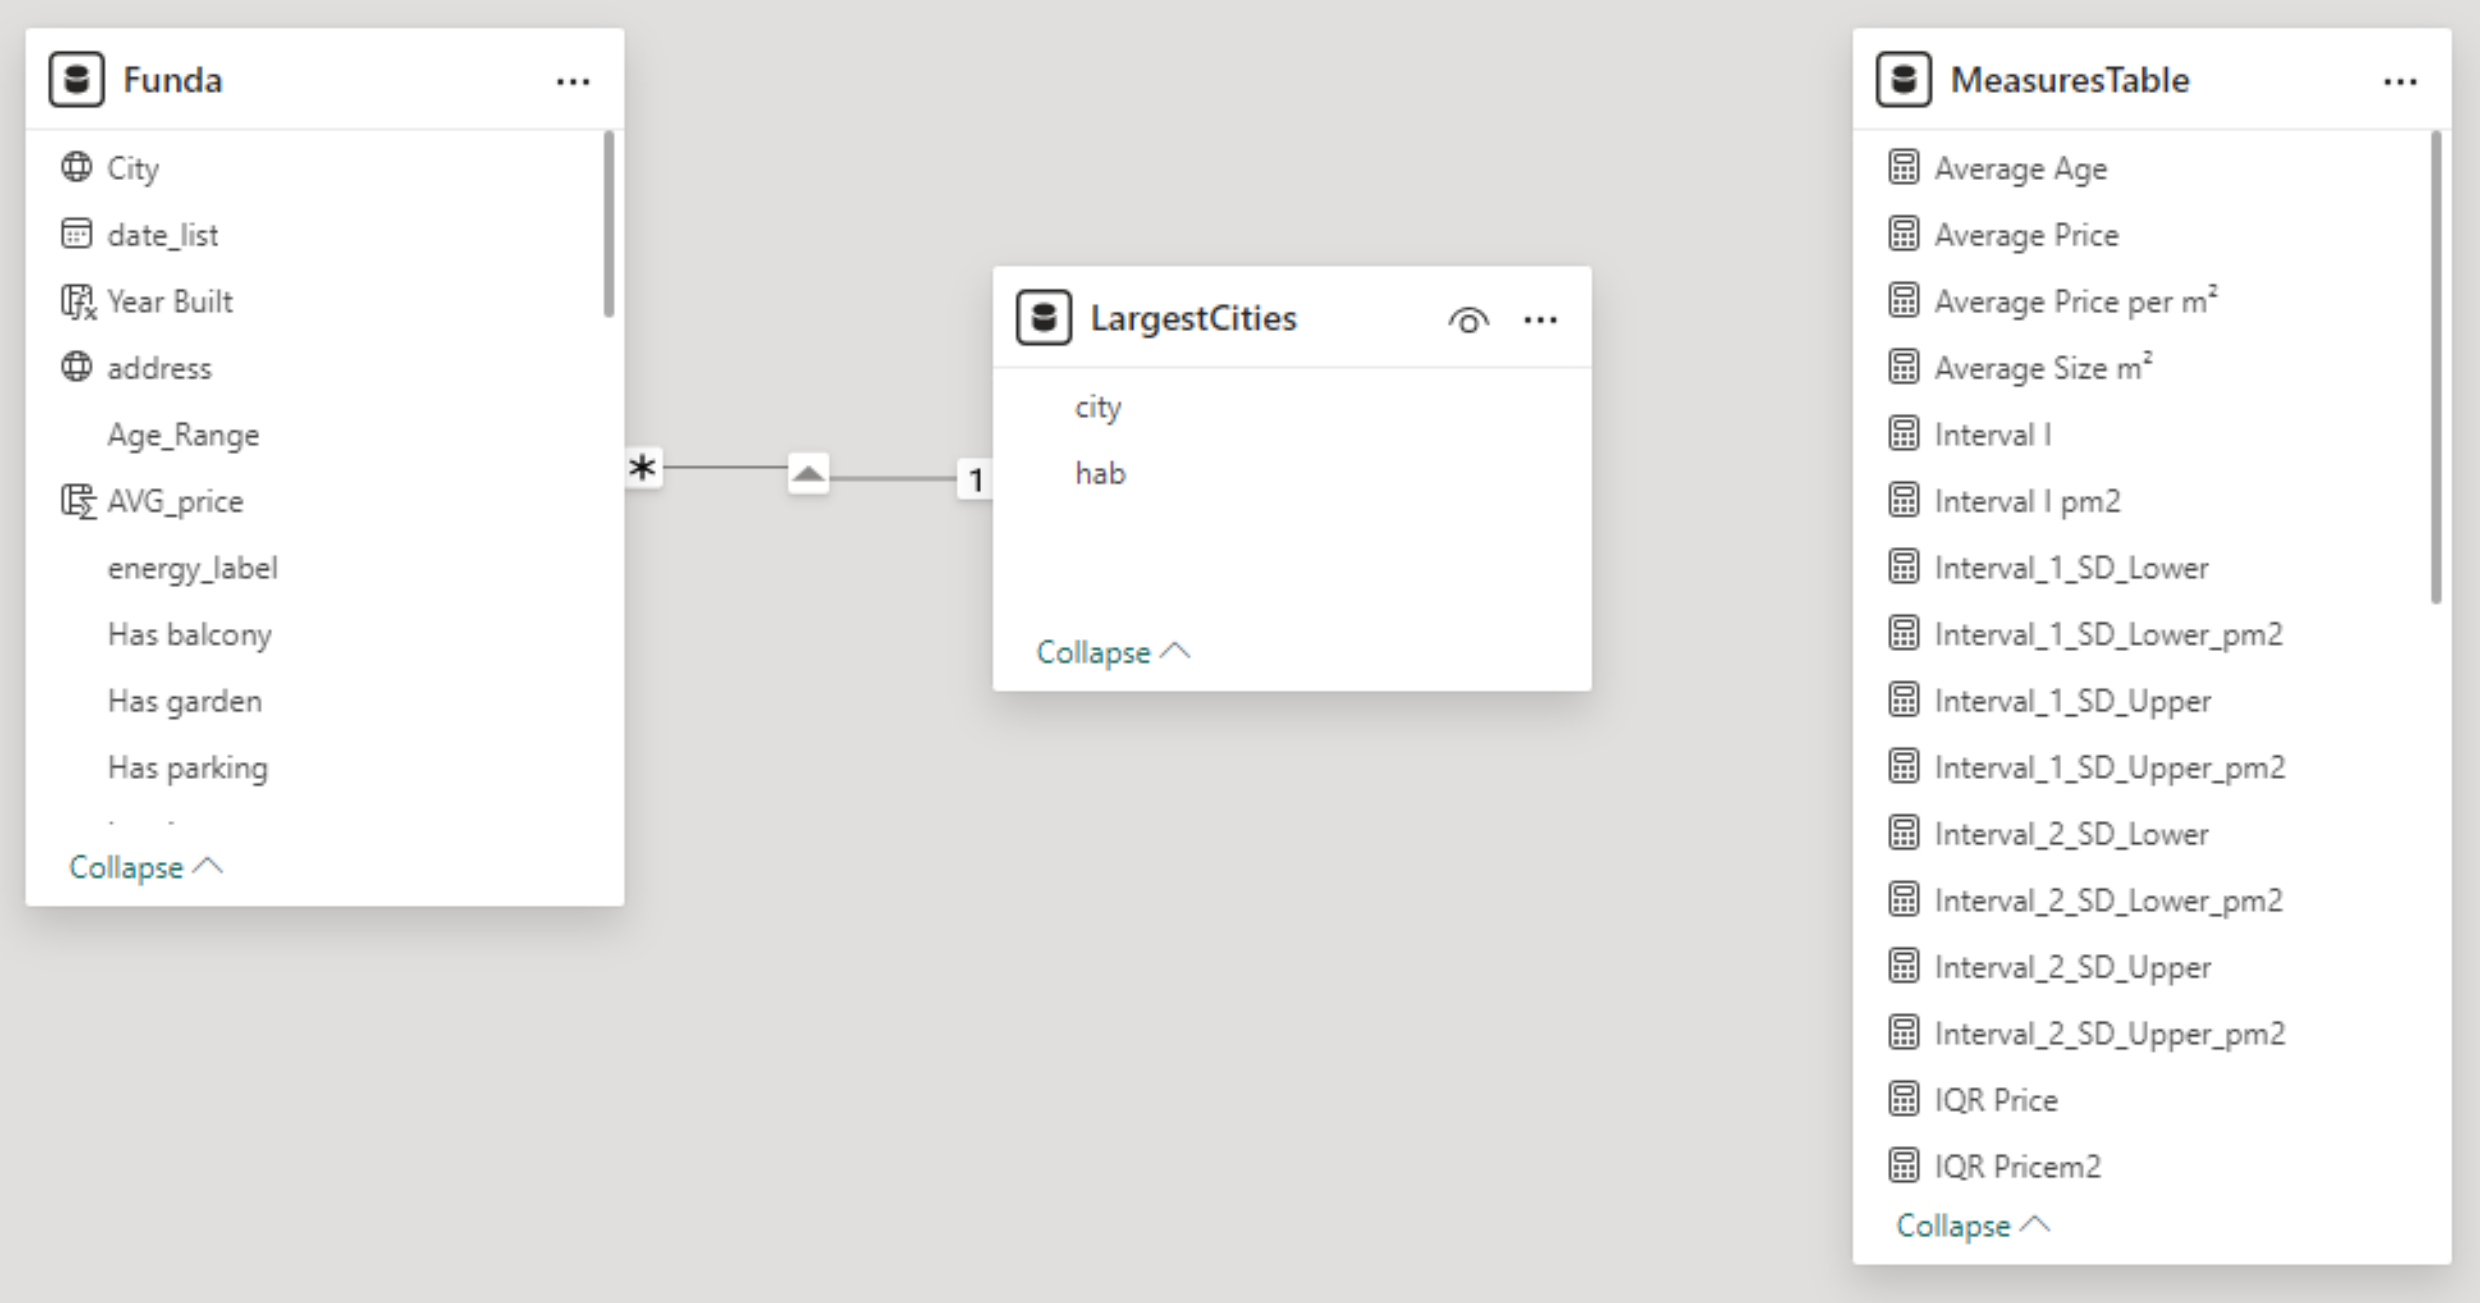
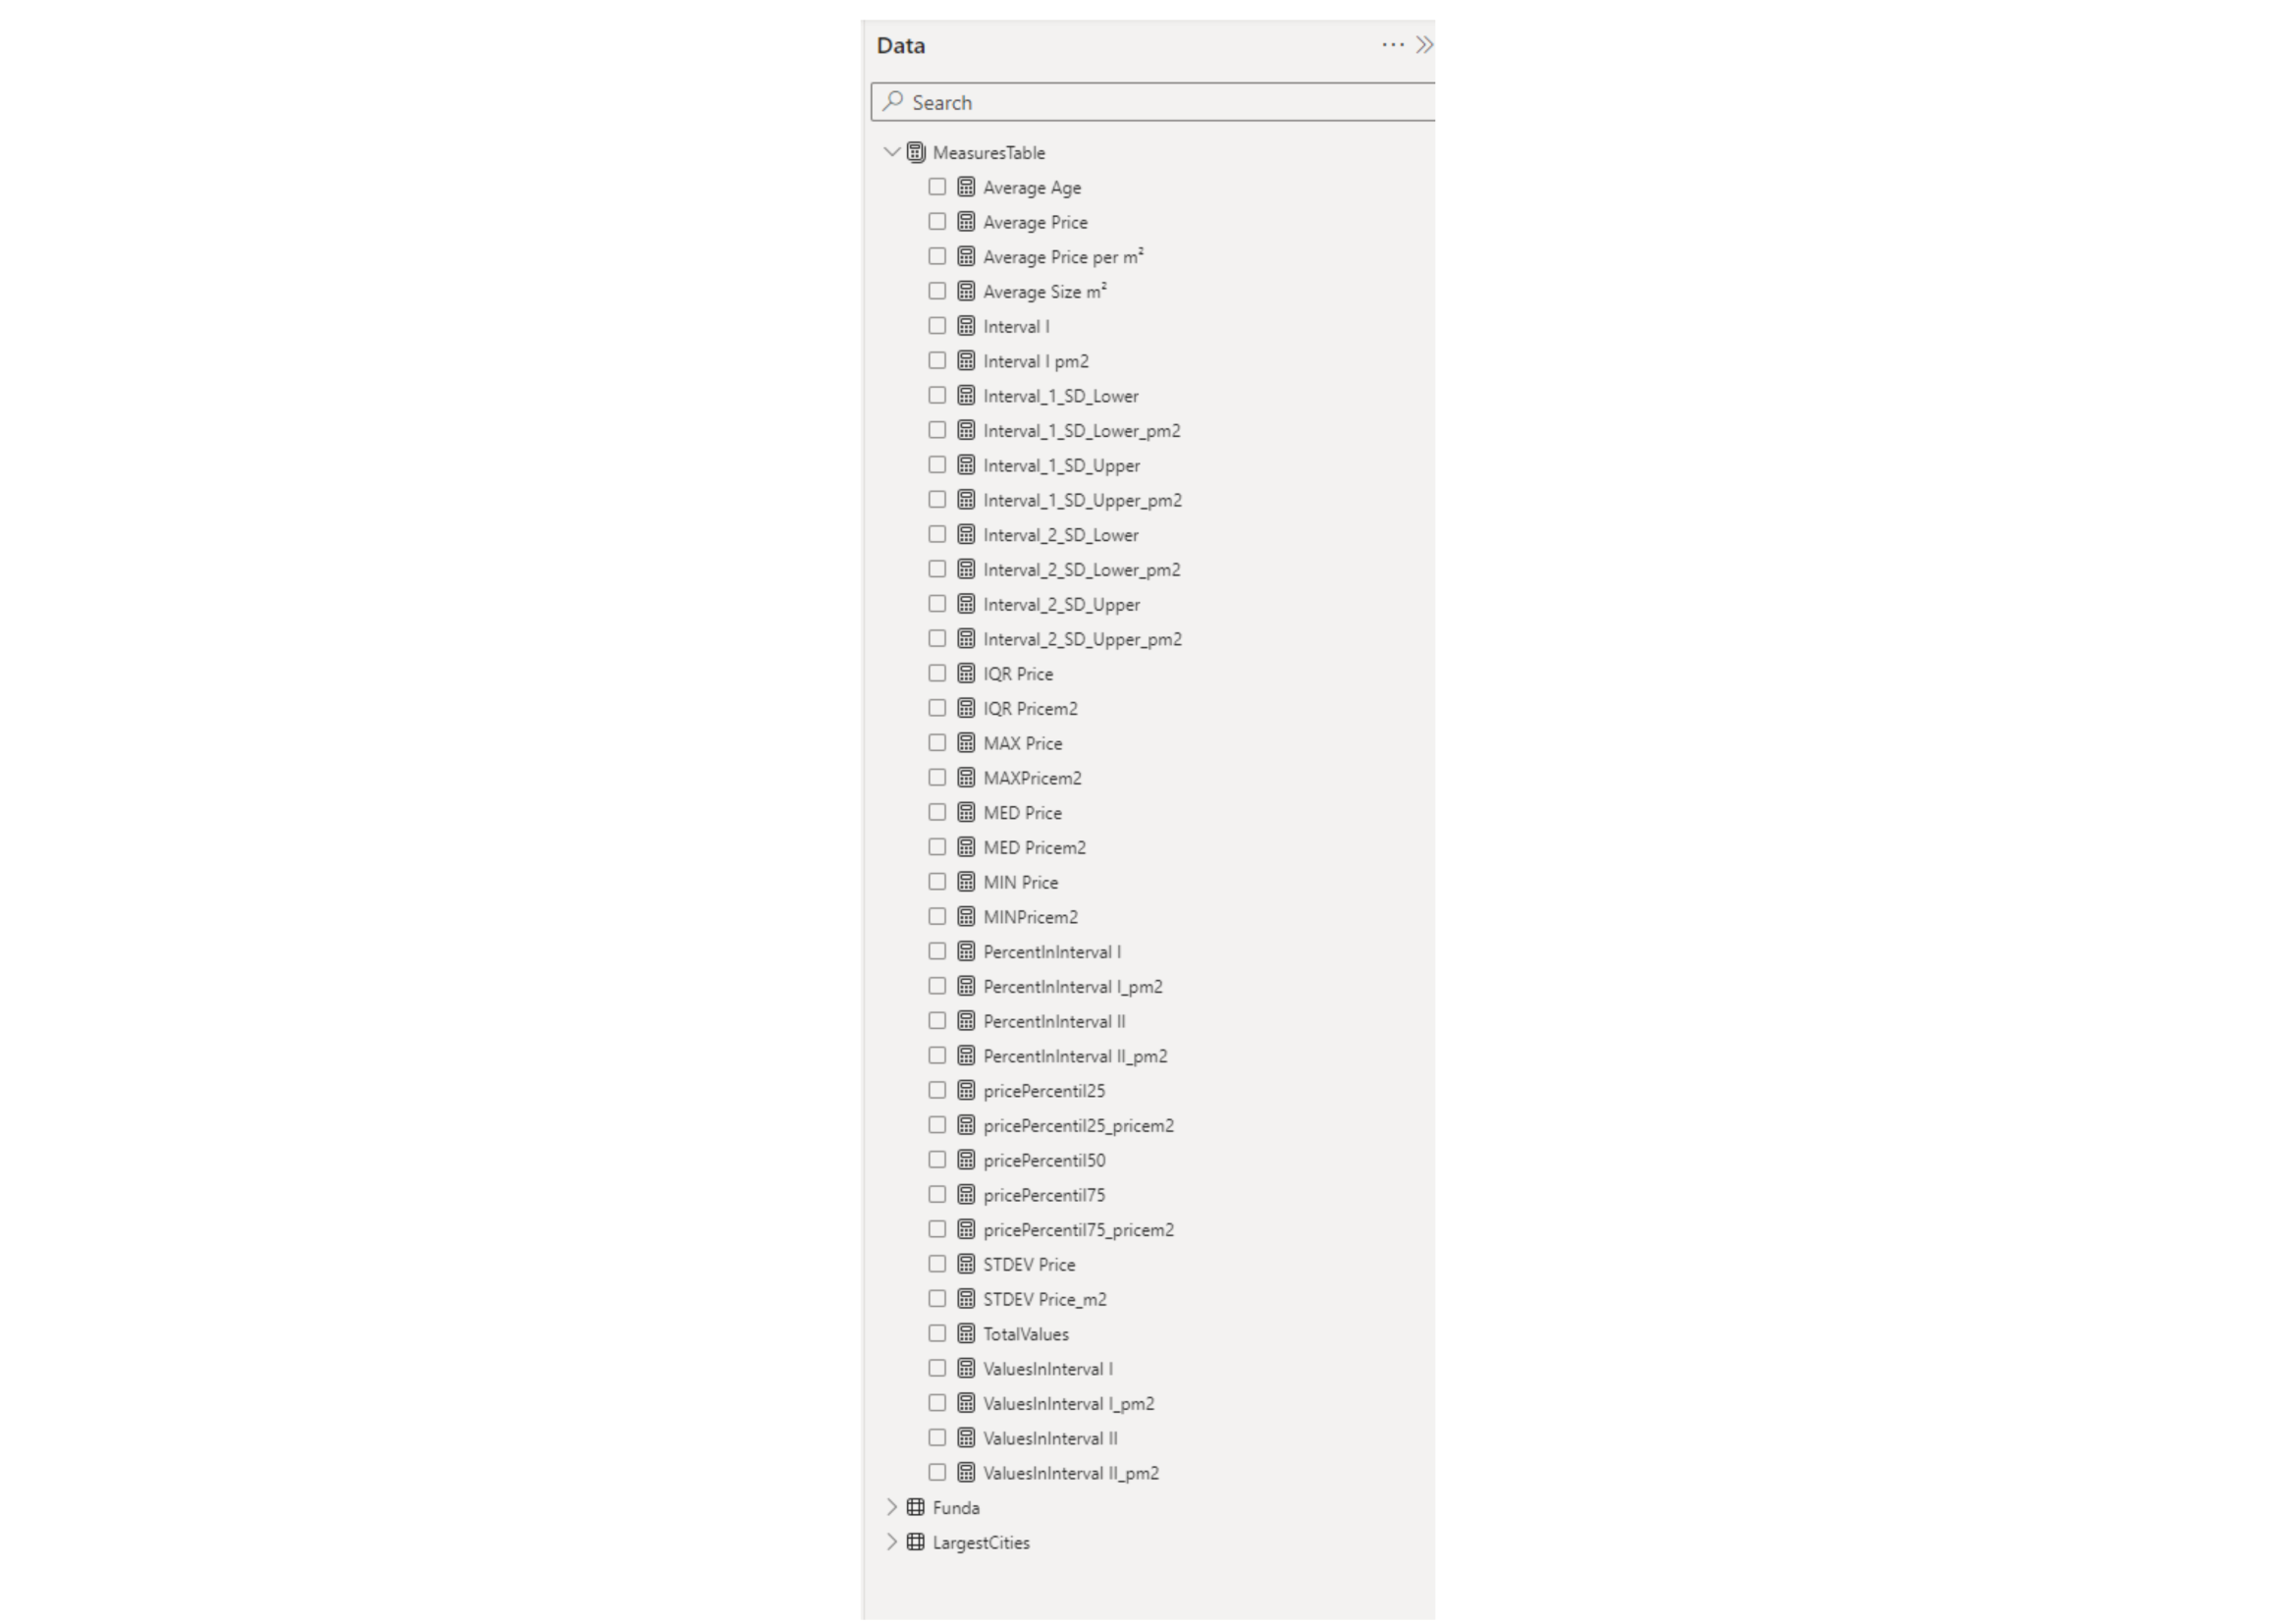
Measures
A few measures were defined using DAX (Data Analysis Expressions), in a separated table, to support the analyses:
Visualization and Results
The results are presented through interactive dashboards in Power BI, offering a detailed analysis of the geographic distribution of properties, common features, price and size statistics, and comparisons between provinces and cities.
1. Geo Distribution
On the first dashboard, it’s possible to see how the properties are distributed within the country. The number and percentage of listings in each province show their contributions to the housing market supply of the country.
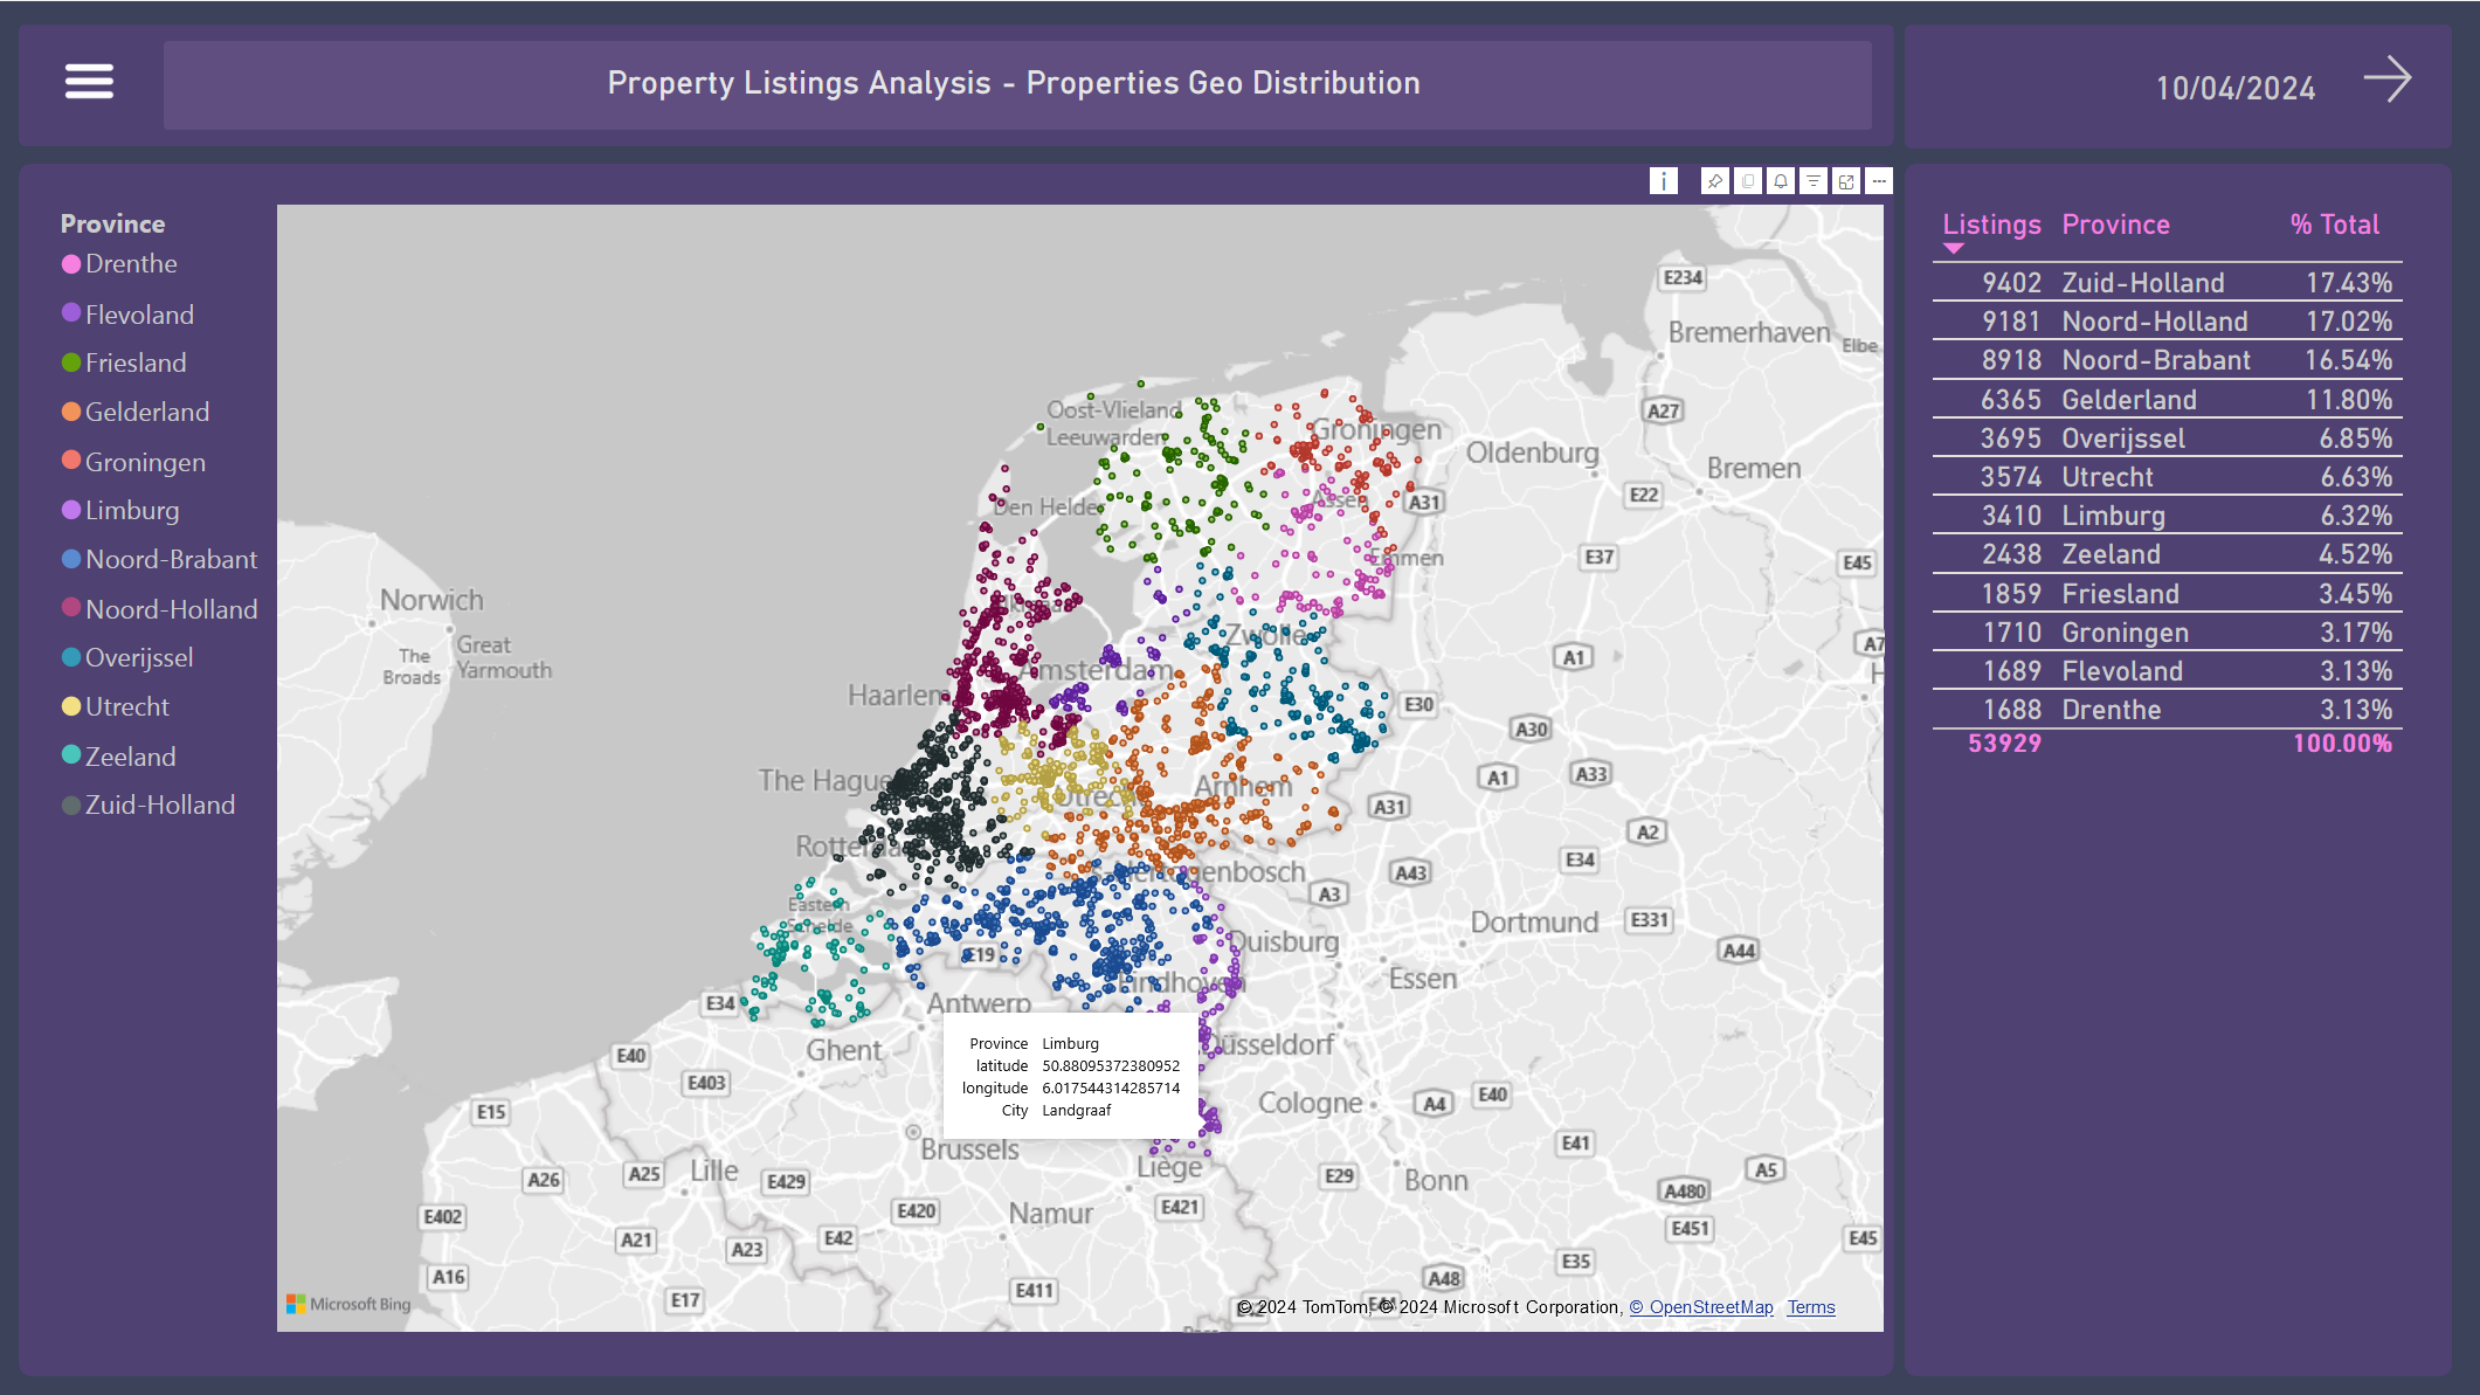
They are 53,929 listings over 2030 cities.
Zuid-Holland, Noord-Holland, and Noord-Brabant are the provinces with the highest number of property listings for sale, accounting for approximately 50% of the country’s total supply. The standard map visual from Power BI uses coordinates as the geolocation indicators.
2. Property Overview
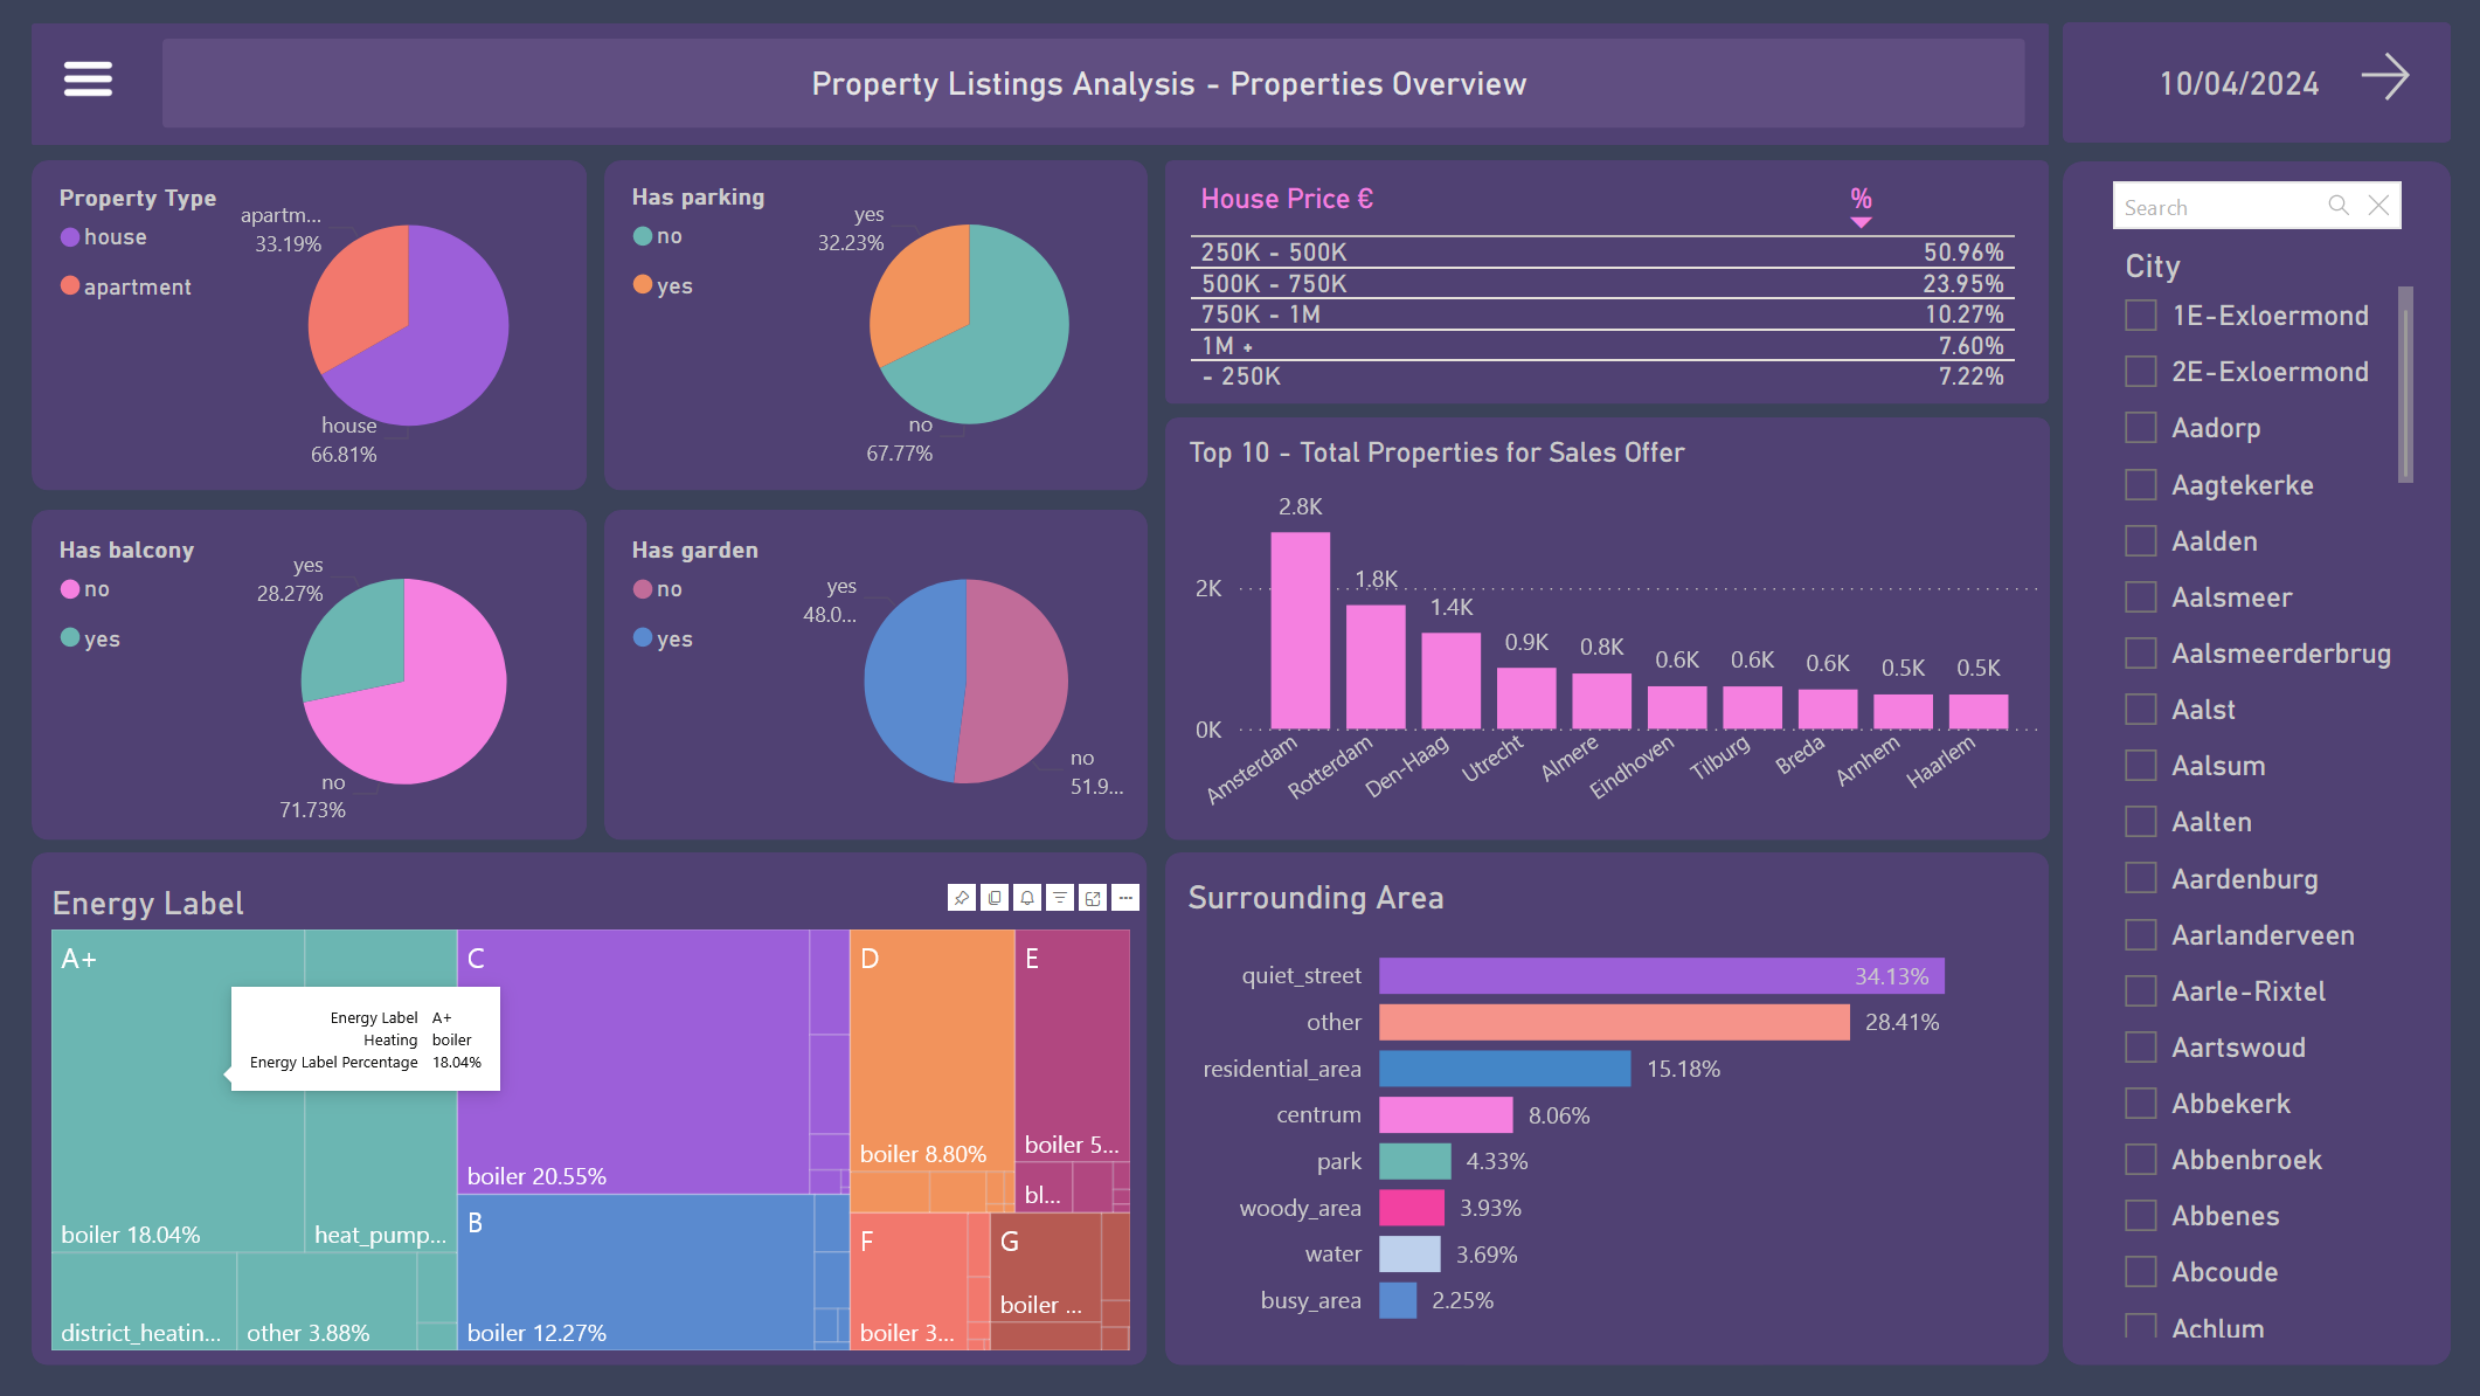
The second dashboard displays the occurrence of some features among the properties.
- The vast majority of houses (74.91%) cost between €250K and €750K
- Amsterdam, Rotterdam, Den Haag, Utrecht, and Almere are the cities with the highest supply of properties
- Approximately two-thirds of residential properties are houses, and one-third are apartments as shown in the pie chart
- Most of them (67.77%) do not have their own parking
- As for the presence of a garden, there is a balance, with 48.02% having a garden and 51.98% not having it
- As for balconies, only 28.27% of properties have it
- The treemap indicates the proportion of the energy labels among the properties as well as their respective types of heating
- The bar chart show us the main surroundings of the properties
- On this page, it is also possible to see the results by city using the filters
3. Property Rooms
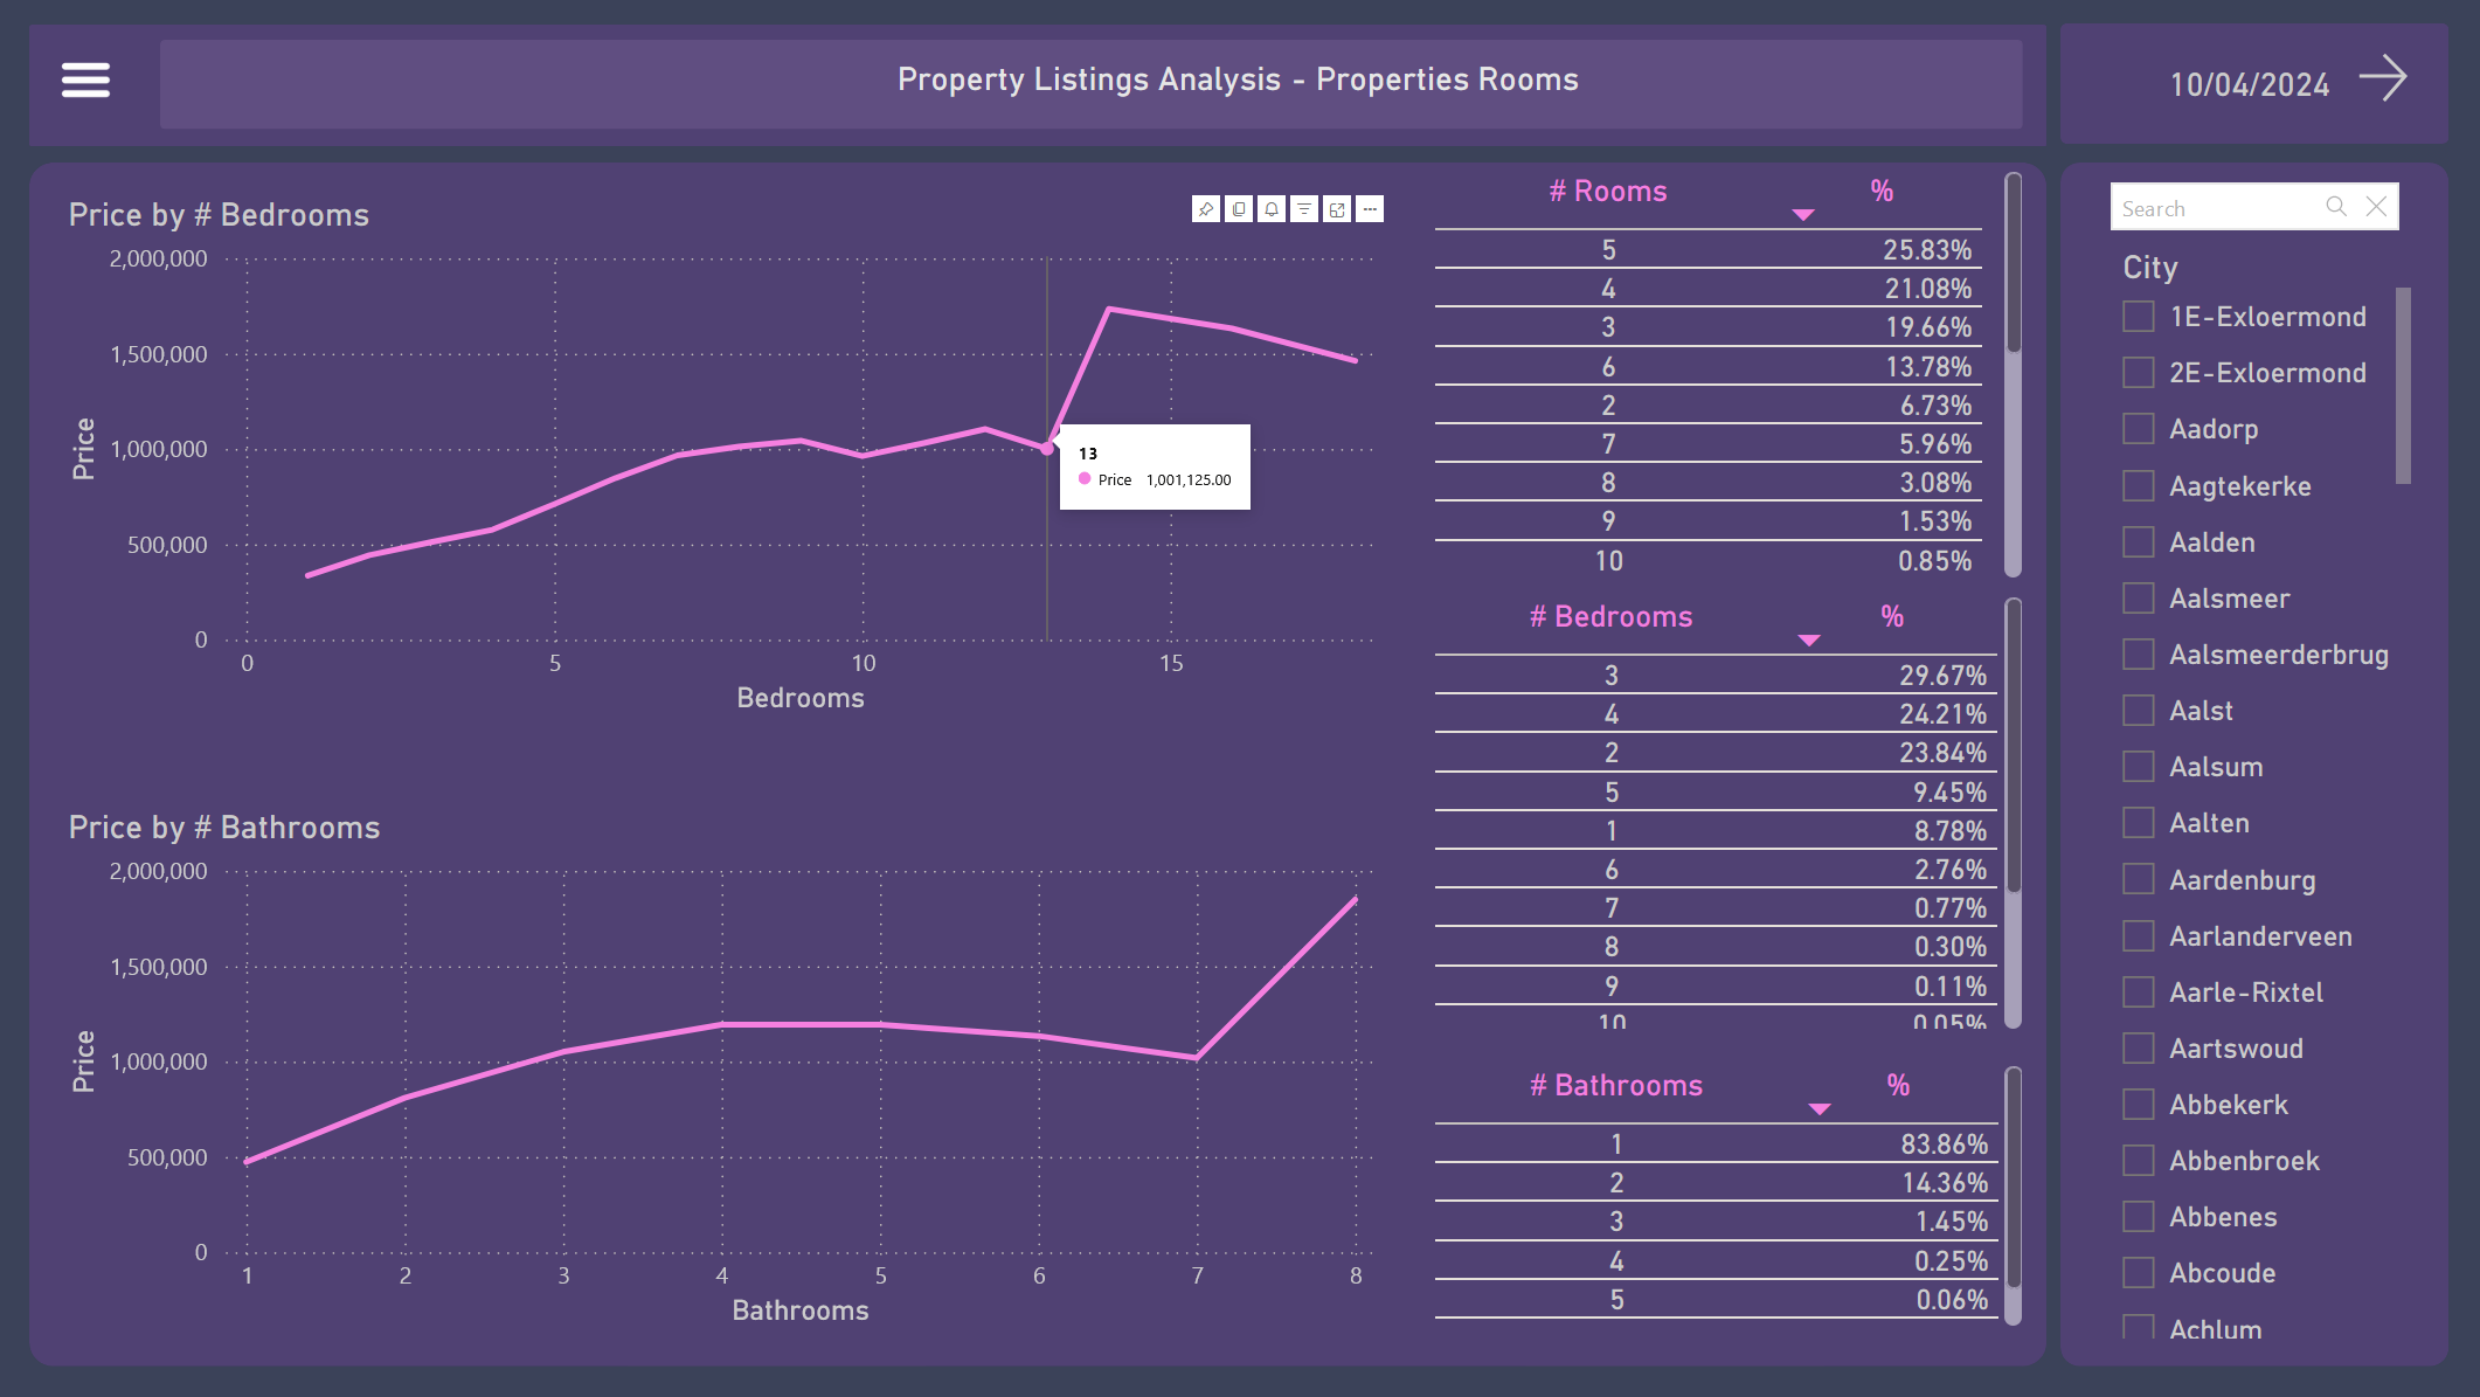
- The line charts indicates a trend of increasing property’s prices in relation to the number of bedrooms and bathrooms
- The majority of houses (66.57%) have between 3, 4, and 5 rooms, 2 to 3 bedrooms, and 1 bathroom
- On this page, it is also possible to see the results by city using the filters
4. Size & Price Stats
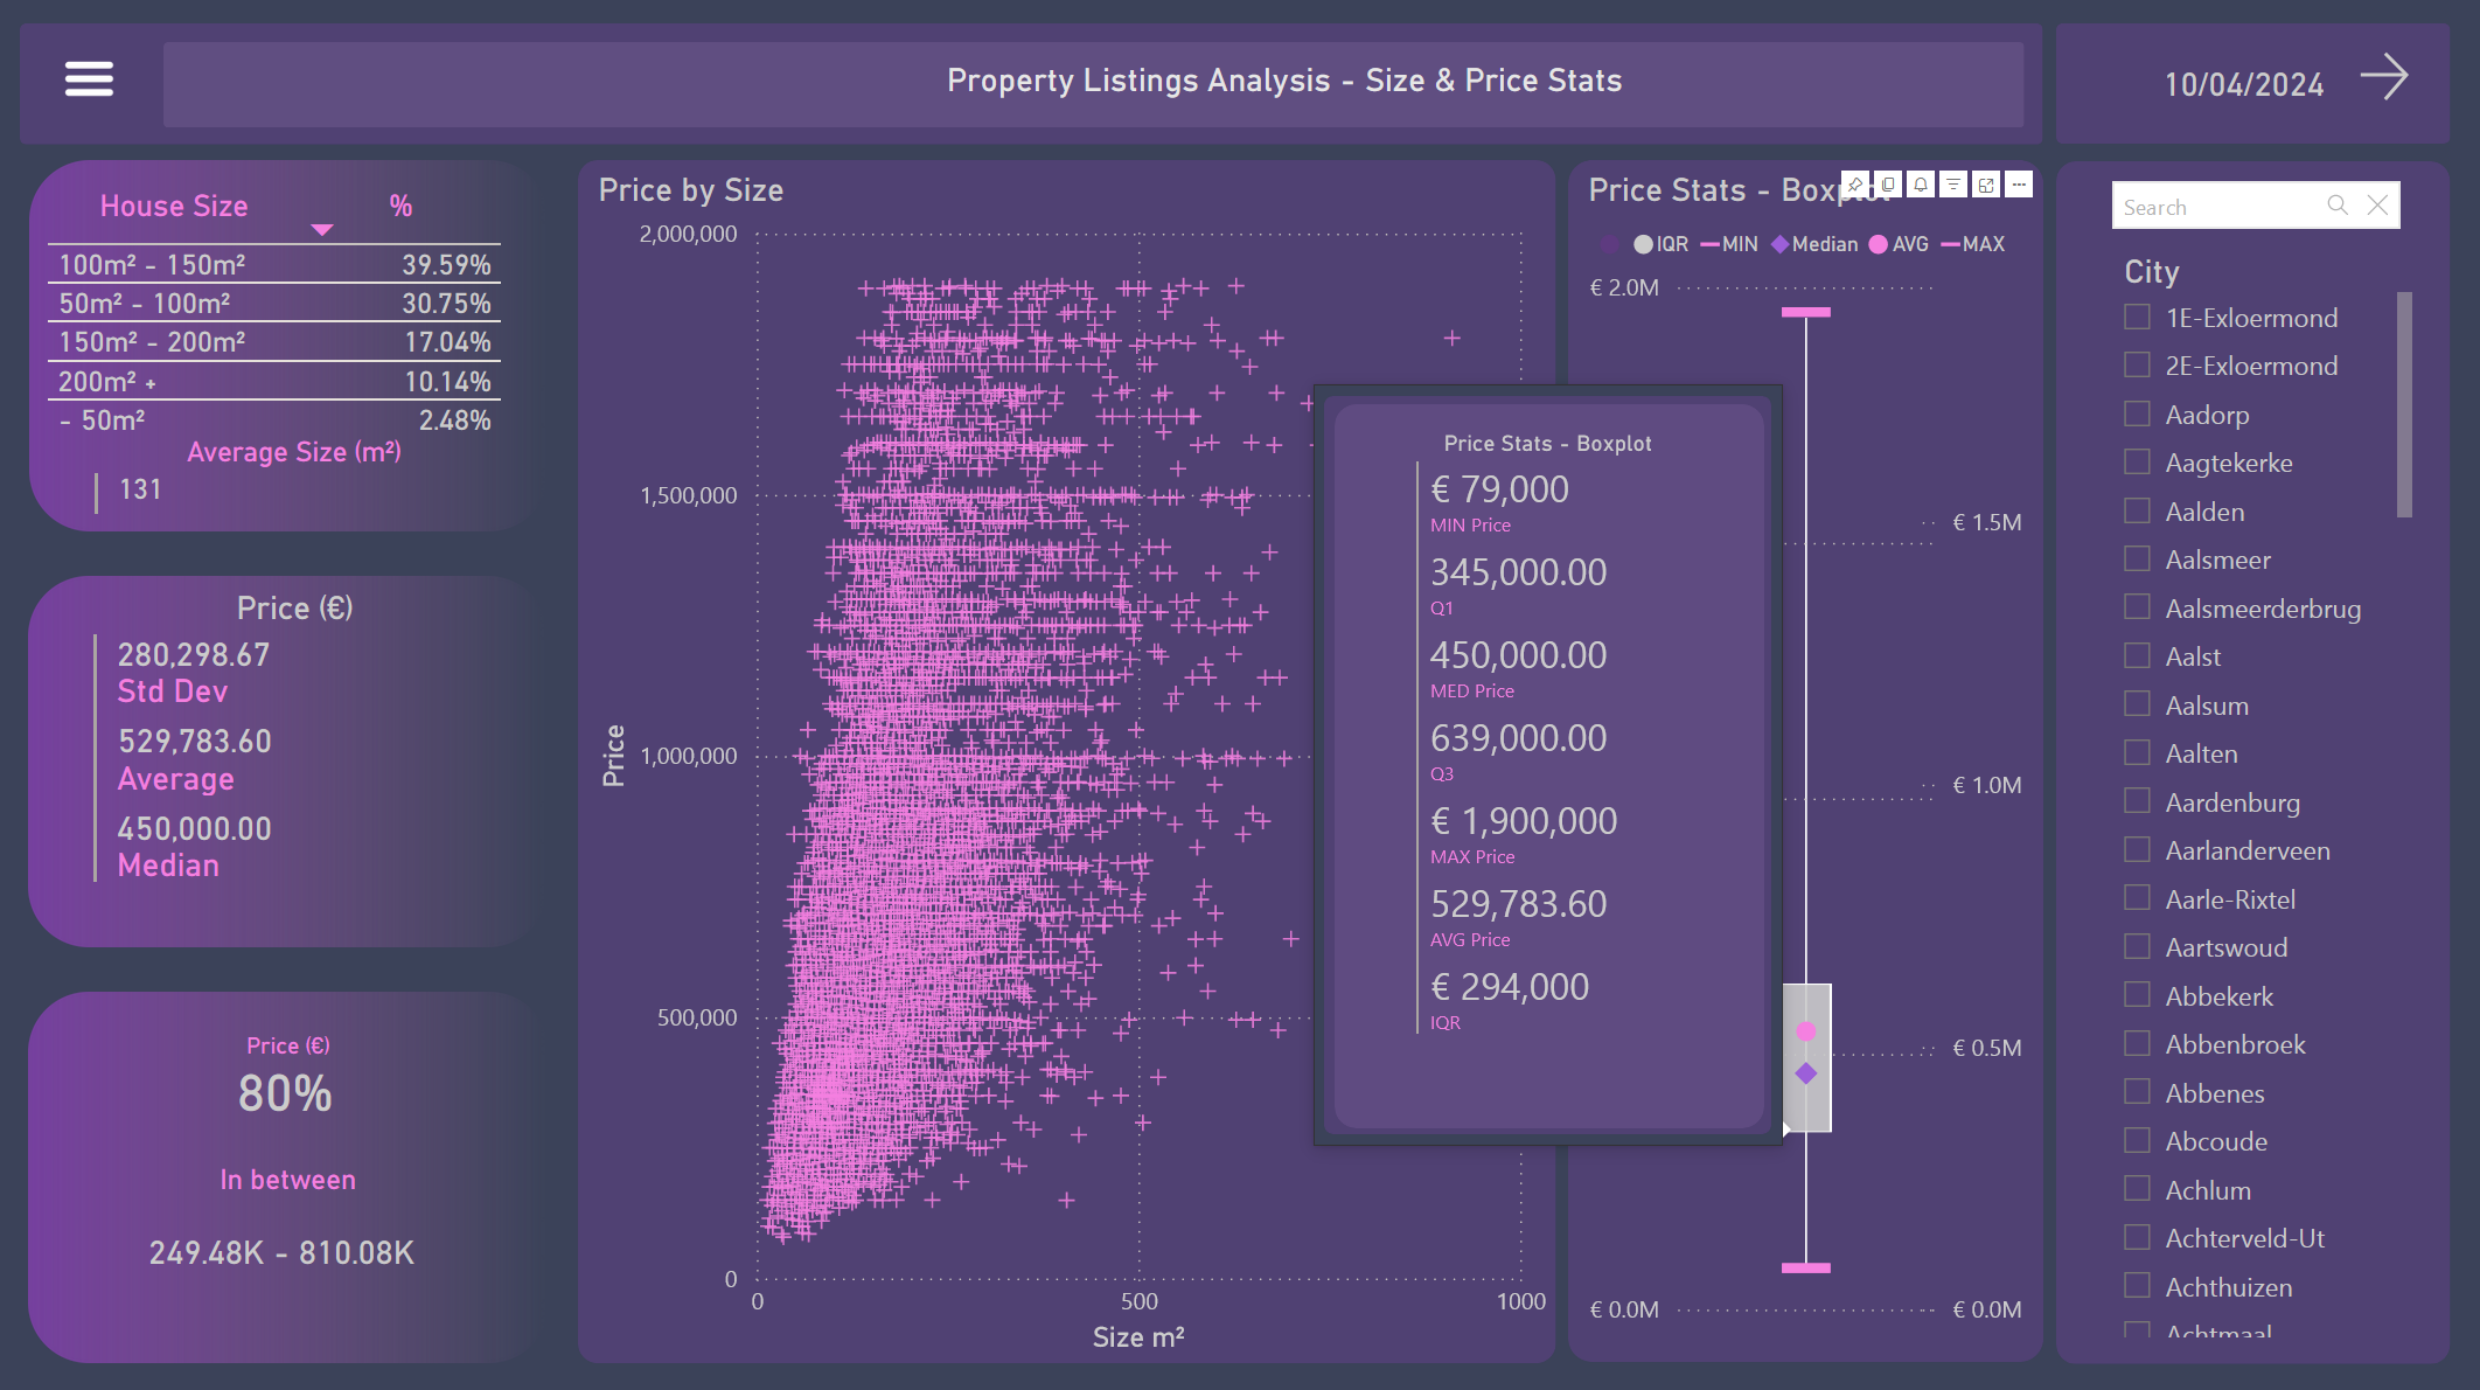
- Regarding size, around 70% of properties measure between 50 and 150 m²
- The overall average size of houses in the country is 131 m²
- The overall average price is €529,783.60
- The median is €450,000
- With a standard deviation of €280,298.67, it can be concluded that 80% of properties fall within the range of €249K and €810K
- Through the scatter plot, a clearer clustering can be observed in areas up to 250m² on the X-axis and up to €1M on the Y-axis
- A boxplot presents the descriptive
- statistics of property prices in the country:
Minimum value: €79,000 Maximum value: €1,900,000 Mean: €529,783.60 Median: €450,000 Standard deviation: €280,298.67 Interquartile range: €294,000 1st quartile: €345,000 3rd quartile: €639,000 - On this page, it is also possible to see the results by city using the filters
5. Age & Size per m² Stats
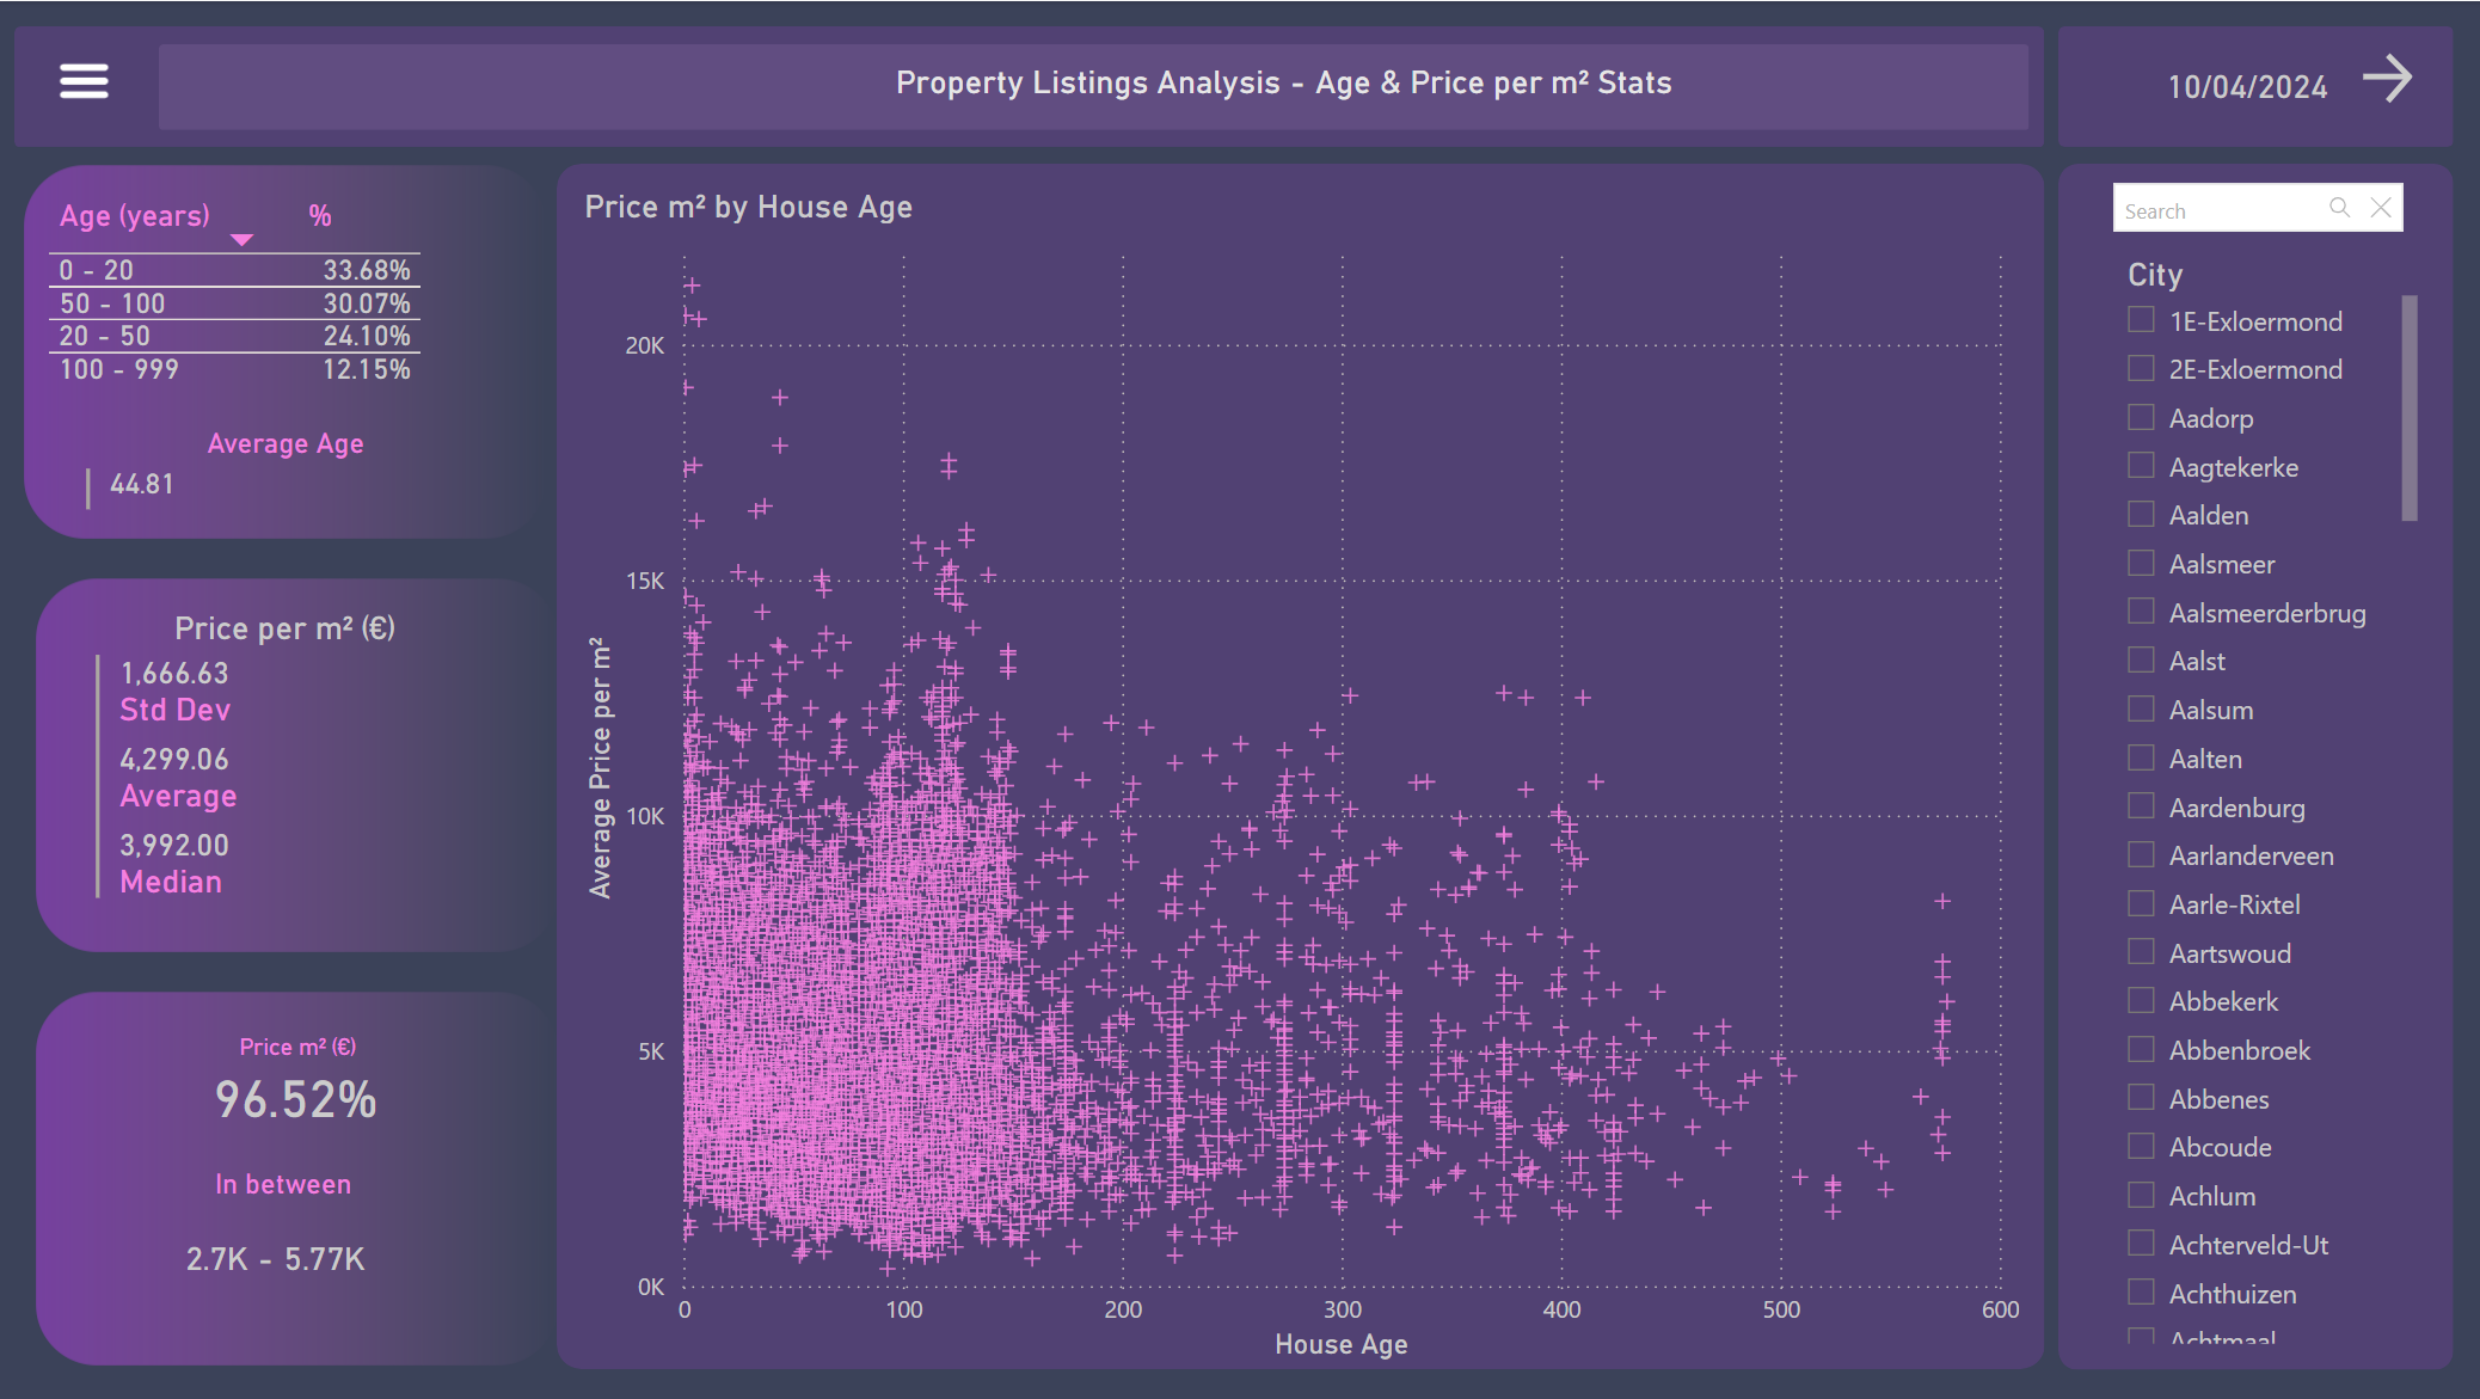
- Regarding age, 57,78% of properties are less than 50 years old
- The overall average age of houses in the country is €44.81 years old
- The overall average price per square meter is €4,299.06
- The median is €3,992.00
- With a standard deviation of €1,666.63, it can be concluded that 96.52% of properties fall within the range of €2.7K and €5.77K
- Through the scatter plot, a clearer clustering can be observed in areas up to 140 years old on the X-axis and up to €10K on the Y-axis
- On this page, it is also possible to see the results by city using the filters
6. Provinces Price & Price per m² Average
The same metrics from the previous boxplot presents now a comparison between the provinces:
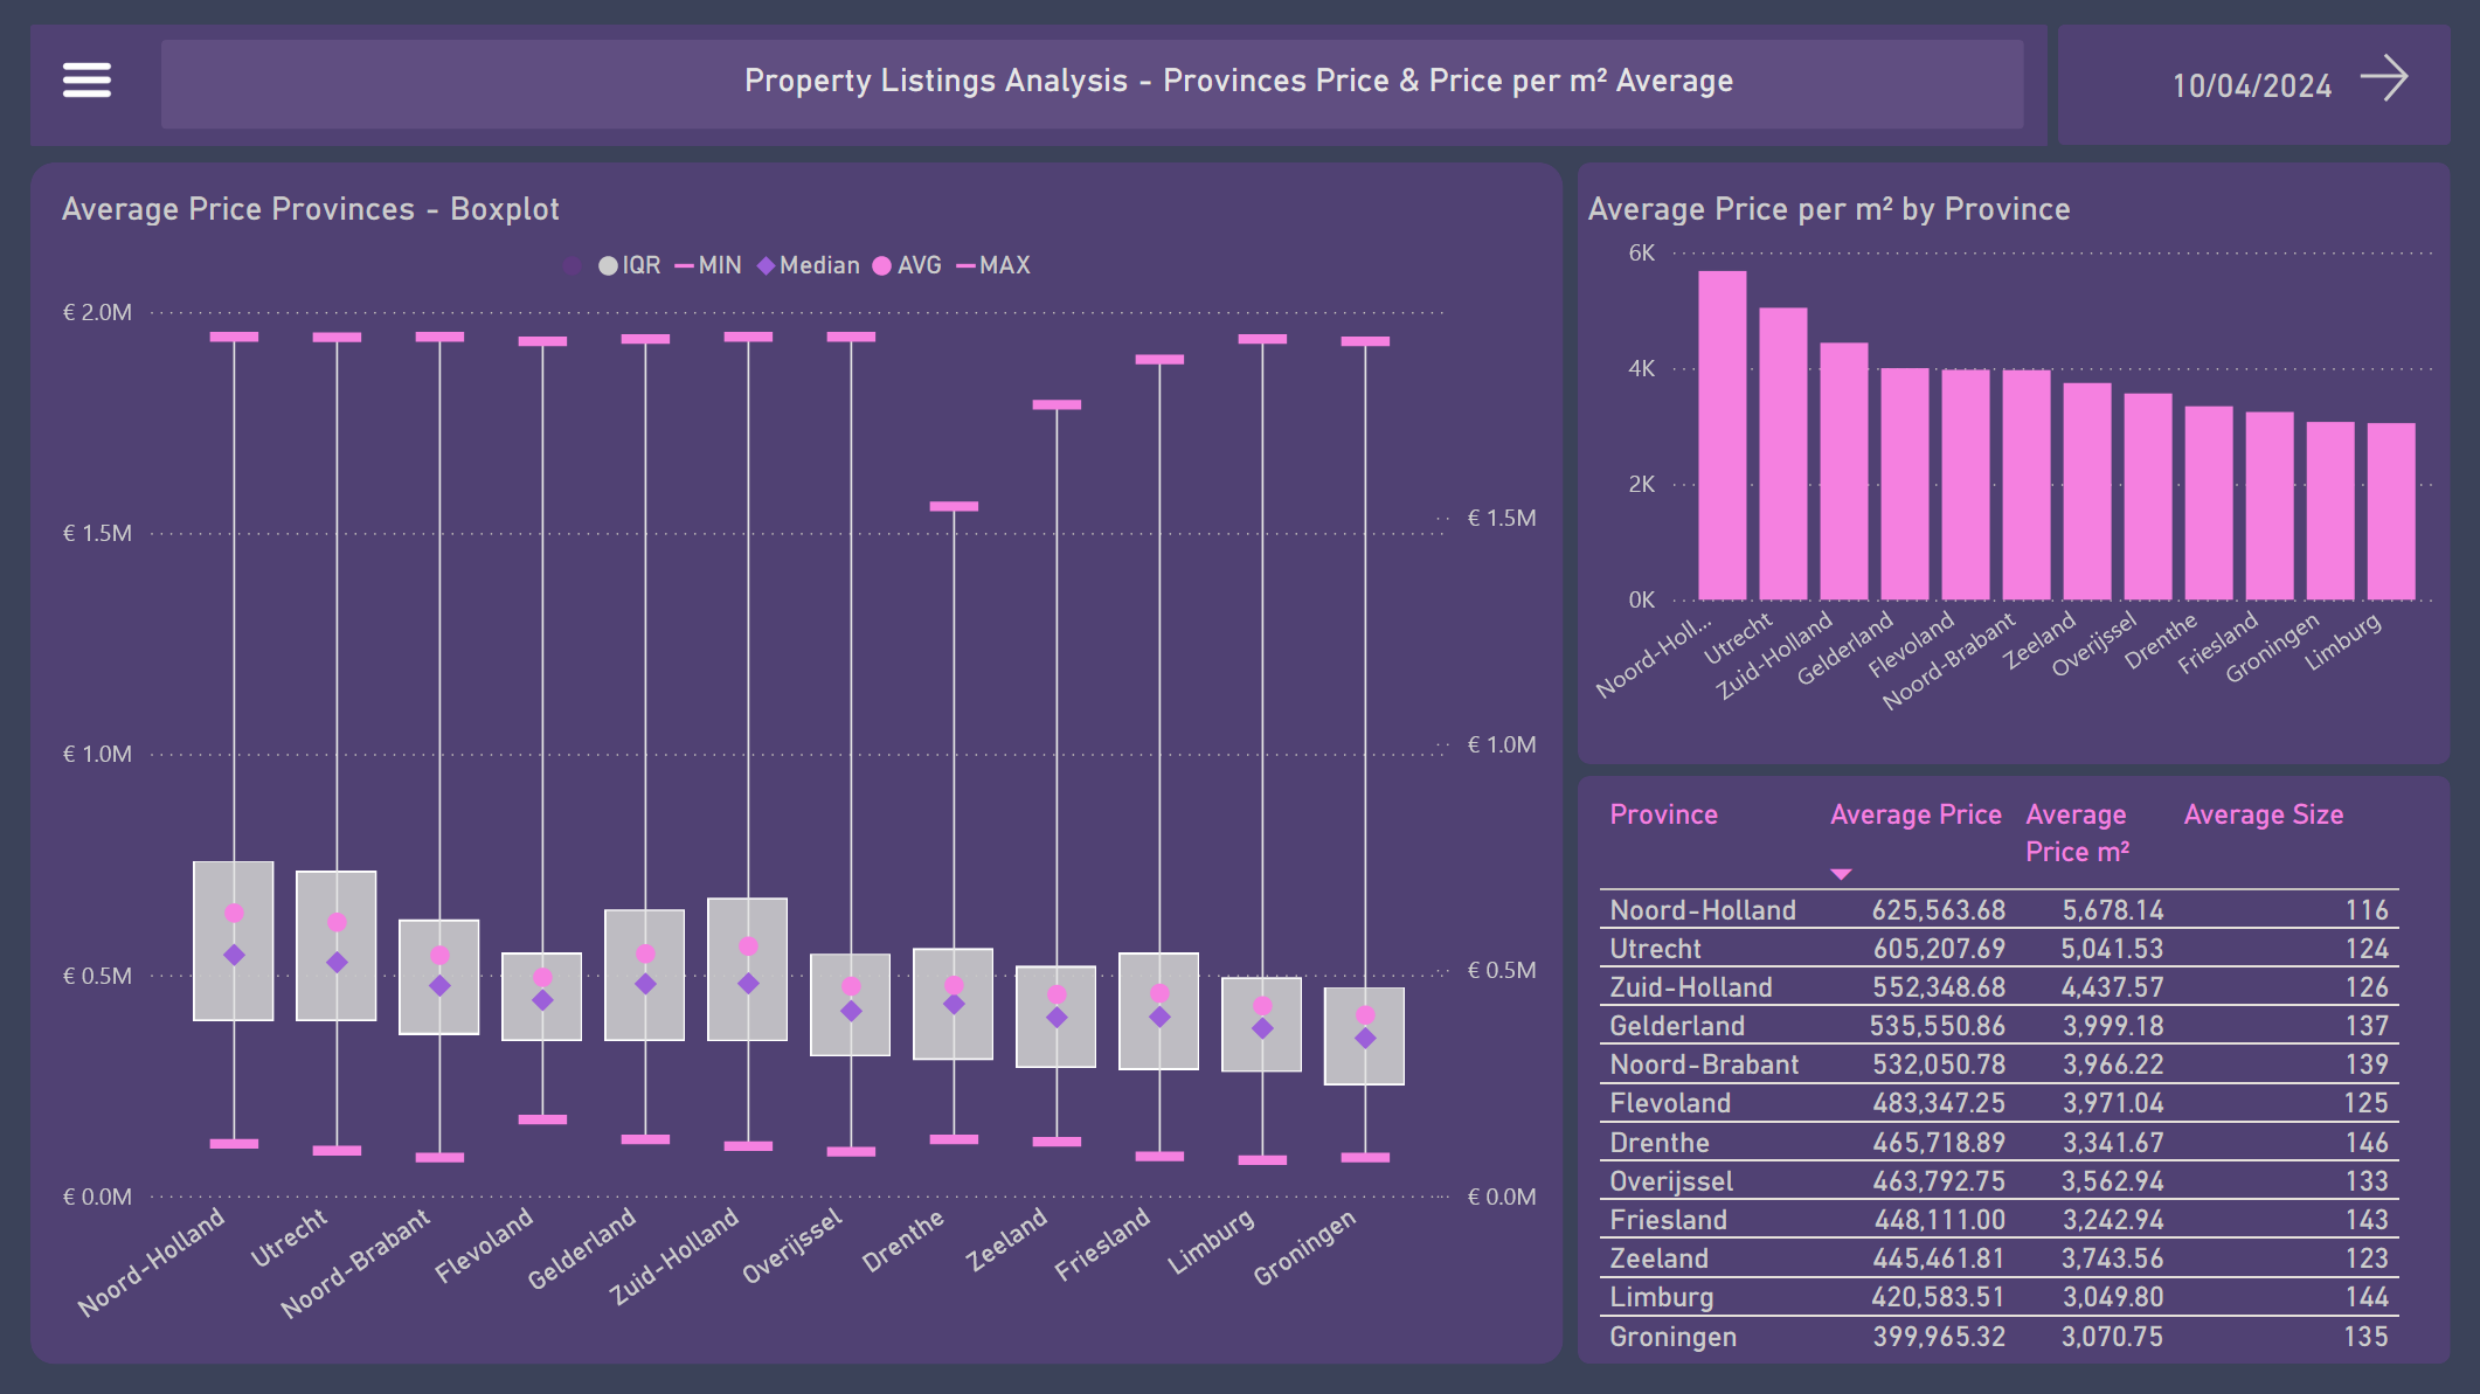
- Boxplot provinces:
- Noord-Holland tops the list with highest average and median property prices, approaching €800K at the upper end of the IQR
- Utrecht and Zuid-Holland follow closely with relatively high average prices
- Groningen and Limburg show the lowest average, under €500K, indicating more affordable prices
- The range of property prices is broad in most provinces, indicating variability in property values
-
Column chart: With €5.67K and €5.04K, Noord-Holland and Utrecht have the highest average prices per square meter among the provinces, while Limburg and Groningen have an average of around €3K.
- The table below contains a summary of all the average prices, prices per m², and sizes of the provinces
7. Provinces Price per m² x Size Average
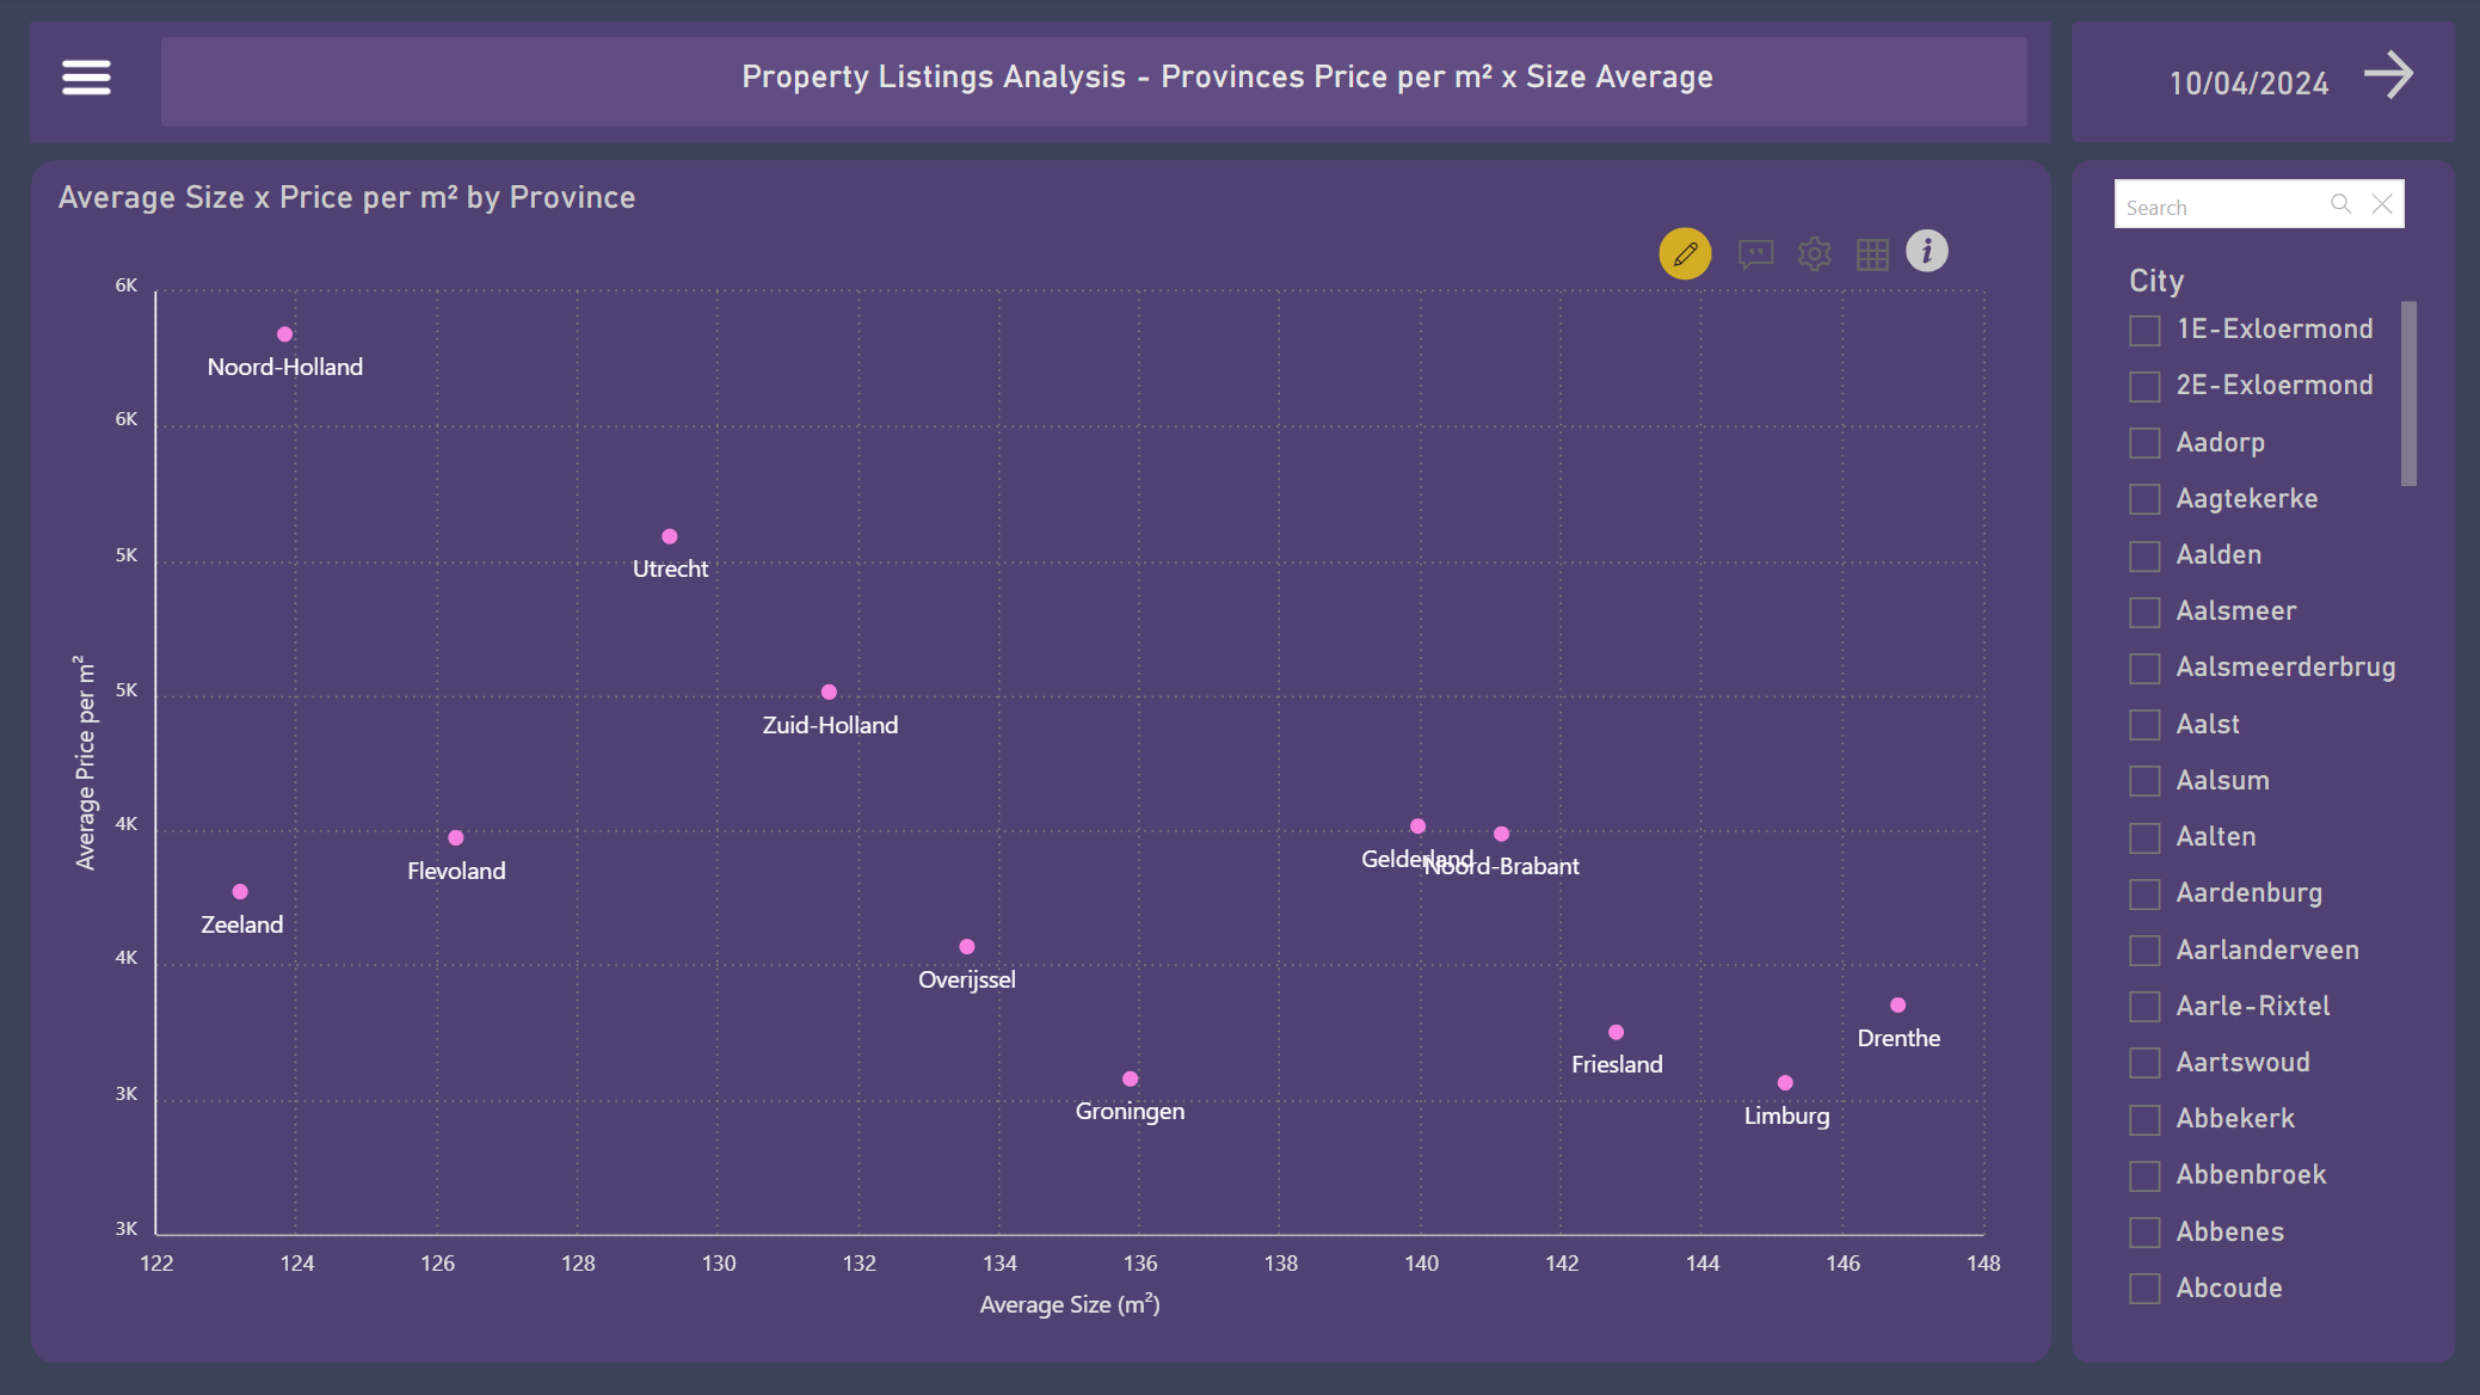
The scatter chart highlights the relationship between the average size of properties and the average price per square meter across different provinces.
-
Noord-Holland and Utrecht are disputed markets with high prices per m² and smaller property sizes;
-
Zuid-Holland offers a balance with moderate property prices and sizes;
-
Zeeland, Groningen, Drenthe, and Limburg provide more affordable options with larger property sizes, making them attractive for buyers seeking more space at lower costs.;
-
Provinces like Gelderland, Noord-Brabant, Friesland, and Overijssel provide a good balance of size and price, catering to a wide range of buyers.
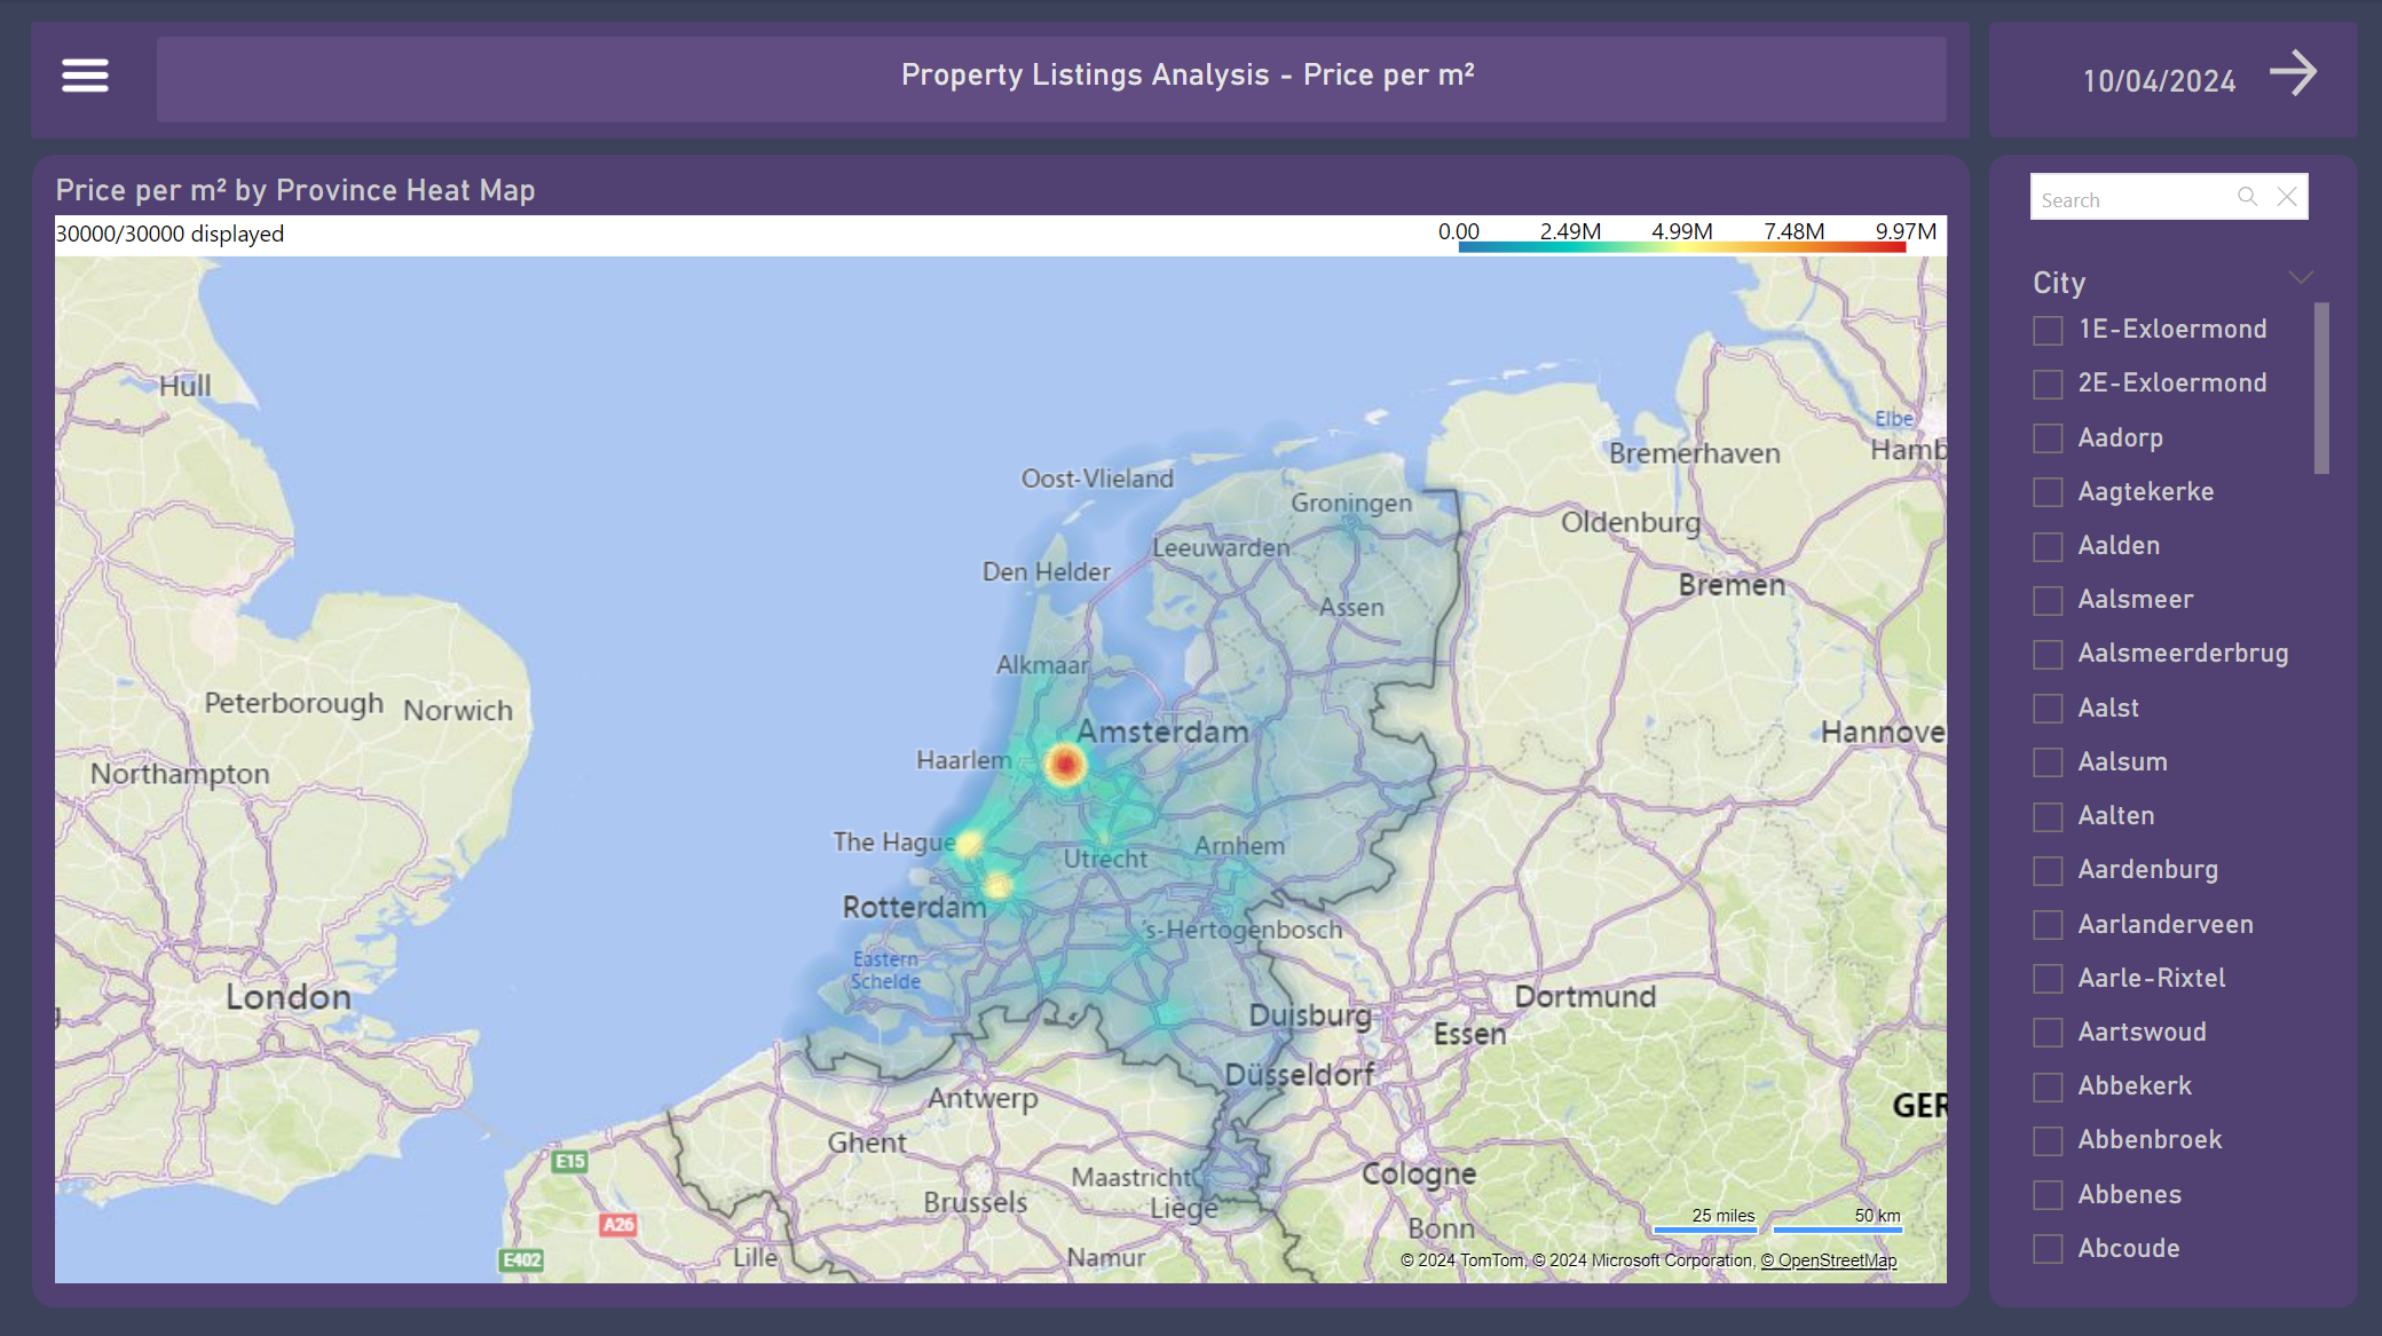
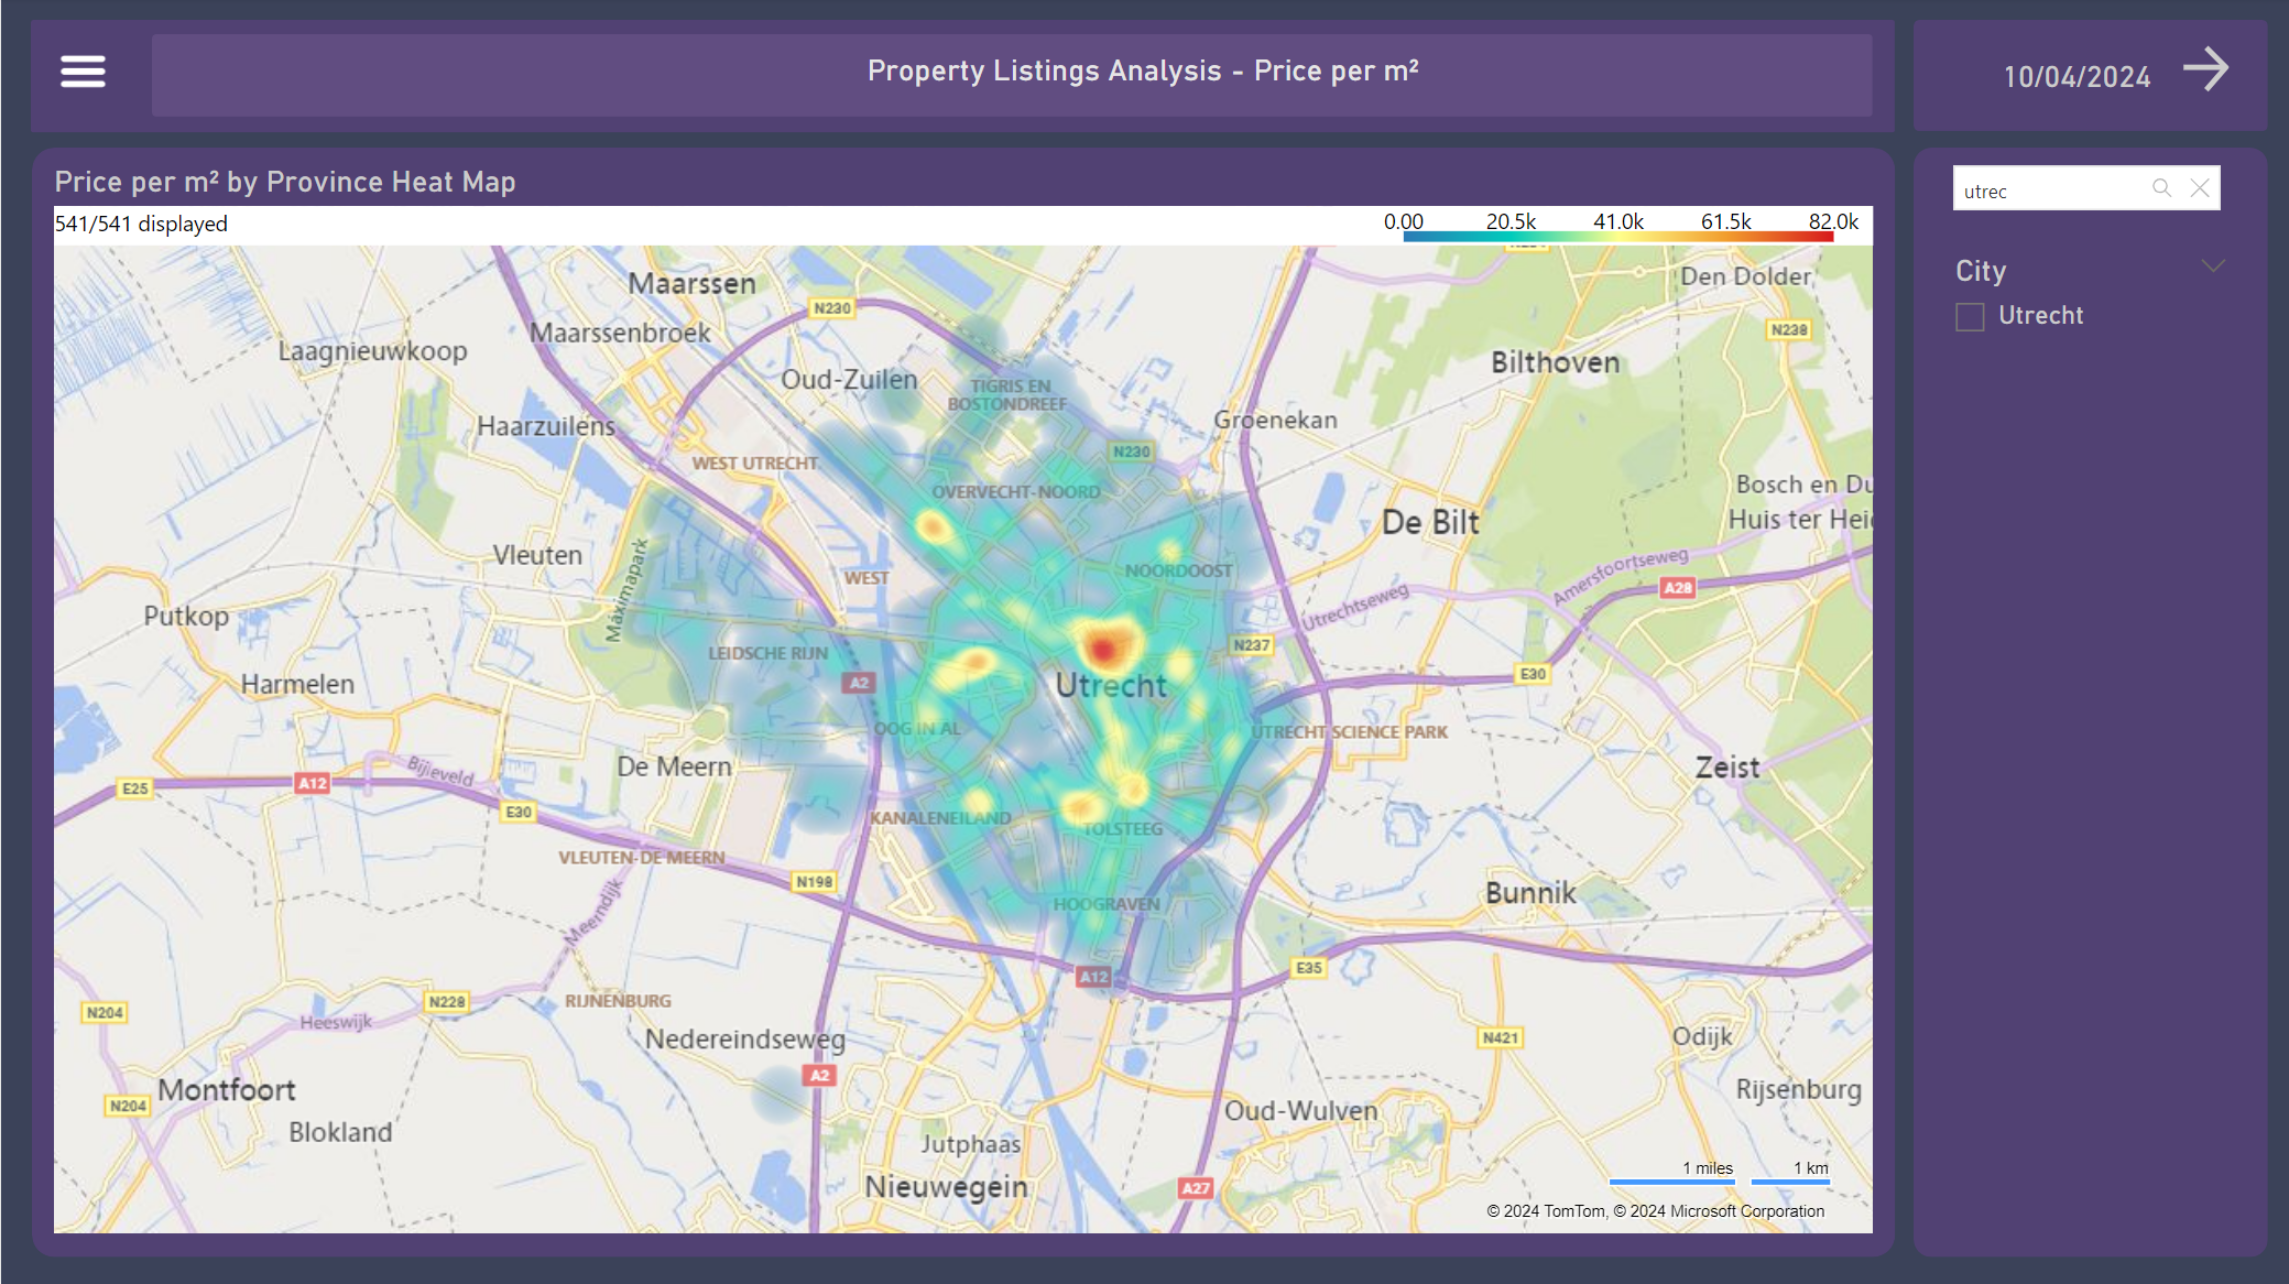
8. Price per m² Heat Map
On the Heat Map, the price per m² values are depicted by color, which allows us to have a general sense of the intensity of the value throughout the country, provinces, cities, and neighborhoods. Some Power BI maps have a point limit for rendering. In the case of the customized visual used in this representation (by Weiwei Cui), the limit is 30,000 points, which can be selected randomly or according to the data input (there is no clear documentation of it). This makes the visualizations more consistent when filtered by provinces or cities.
9. Major Cities by Population
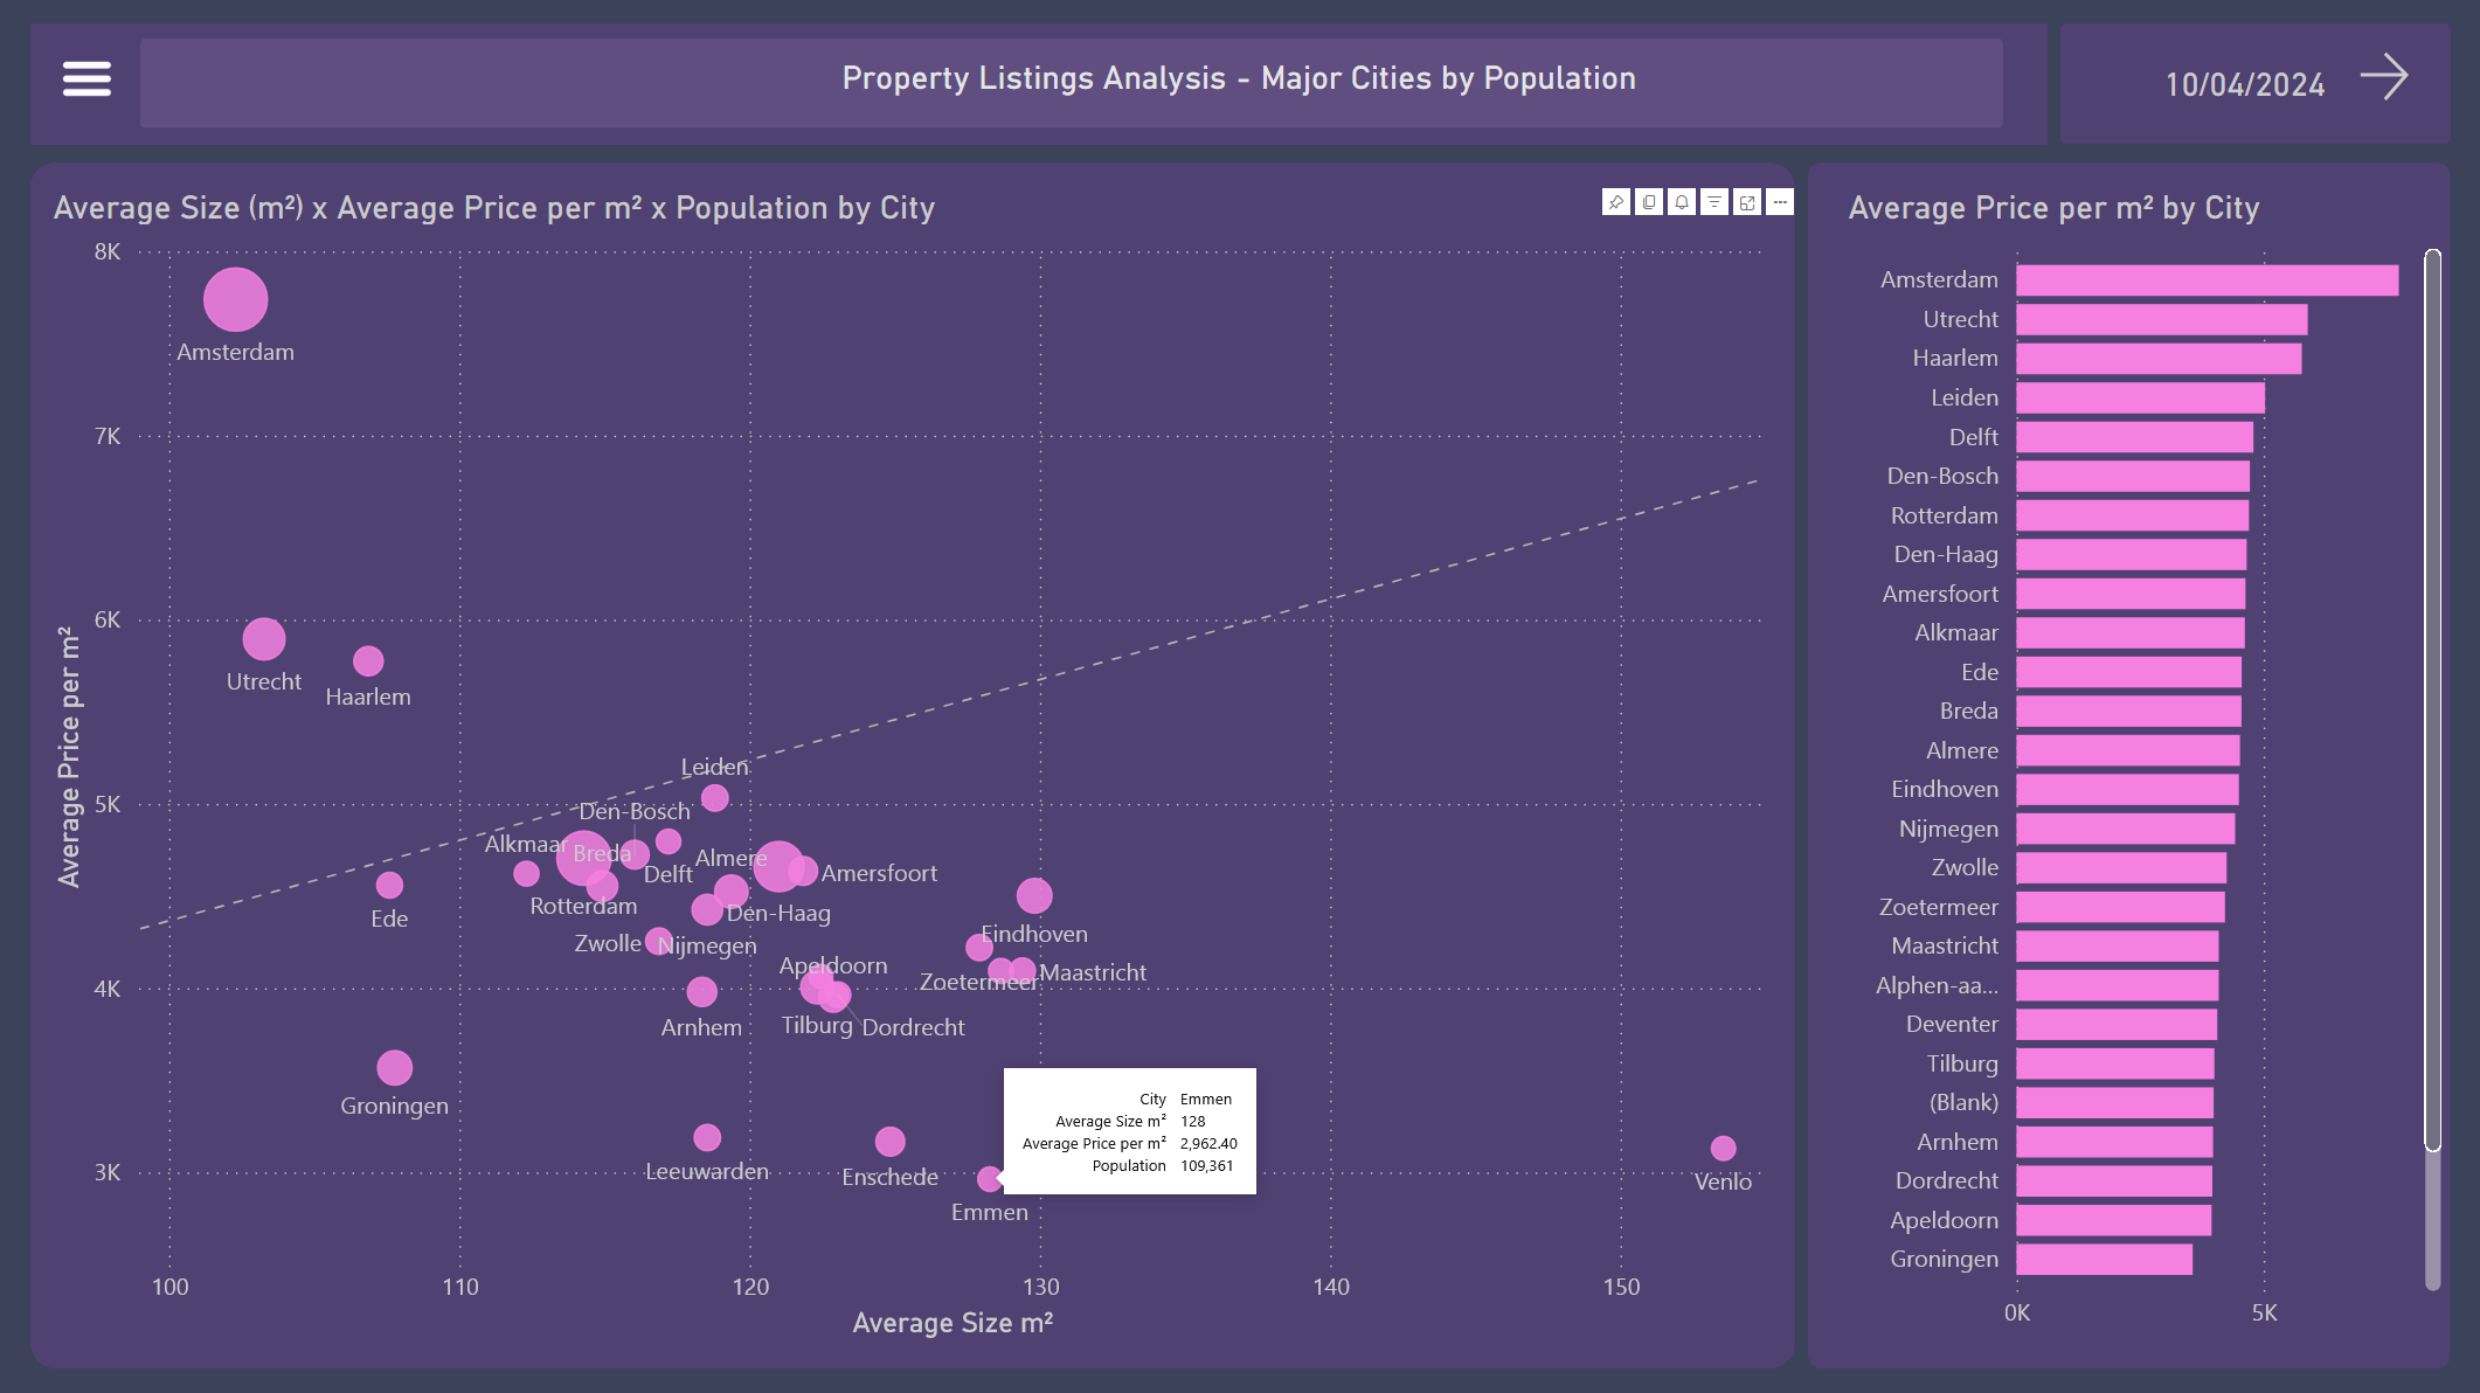
Now the scatter chart represents, in three dimensions, the main cities of the Netherlands with their average prices per m², average sizes, and population densities.
-
Amsterdam, standing alone, represents the lowest value for money in terms of price per m² and space; while at the other extreme, also standing alone, is Venlo, with the second lowest average prices and the largest average space among the 32 cities.
-
A dashed line in the background shows the increasing trend between the variables price per m² and size.
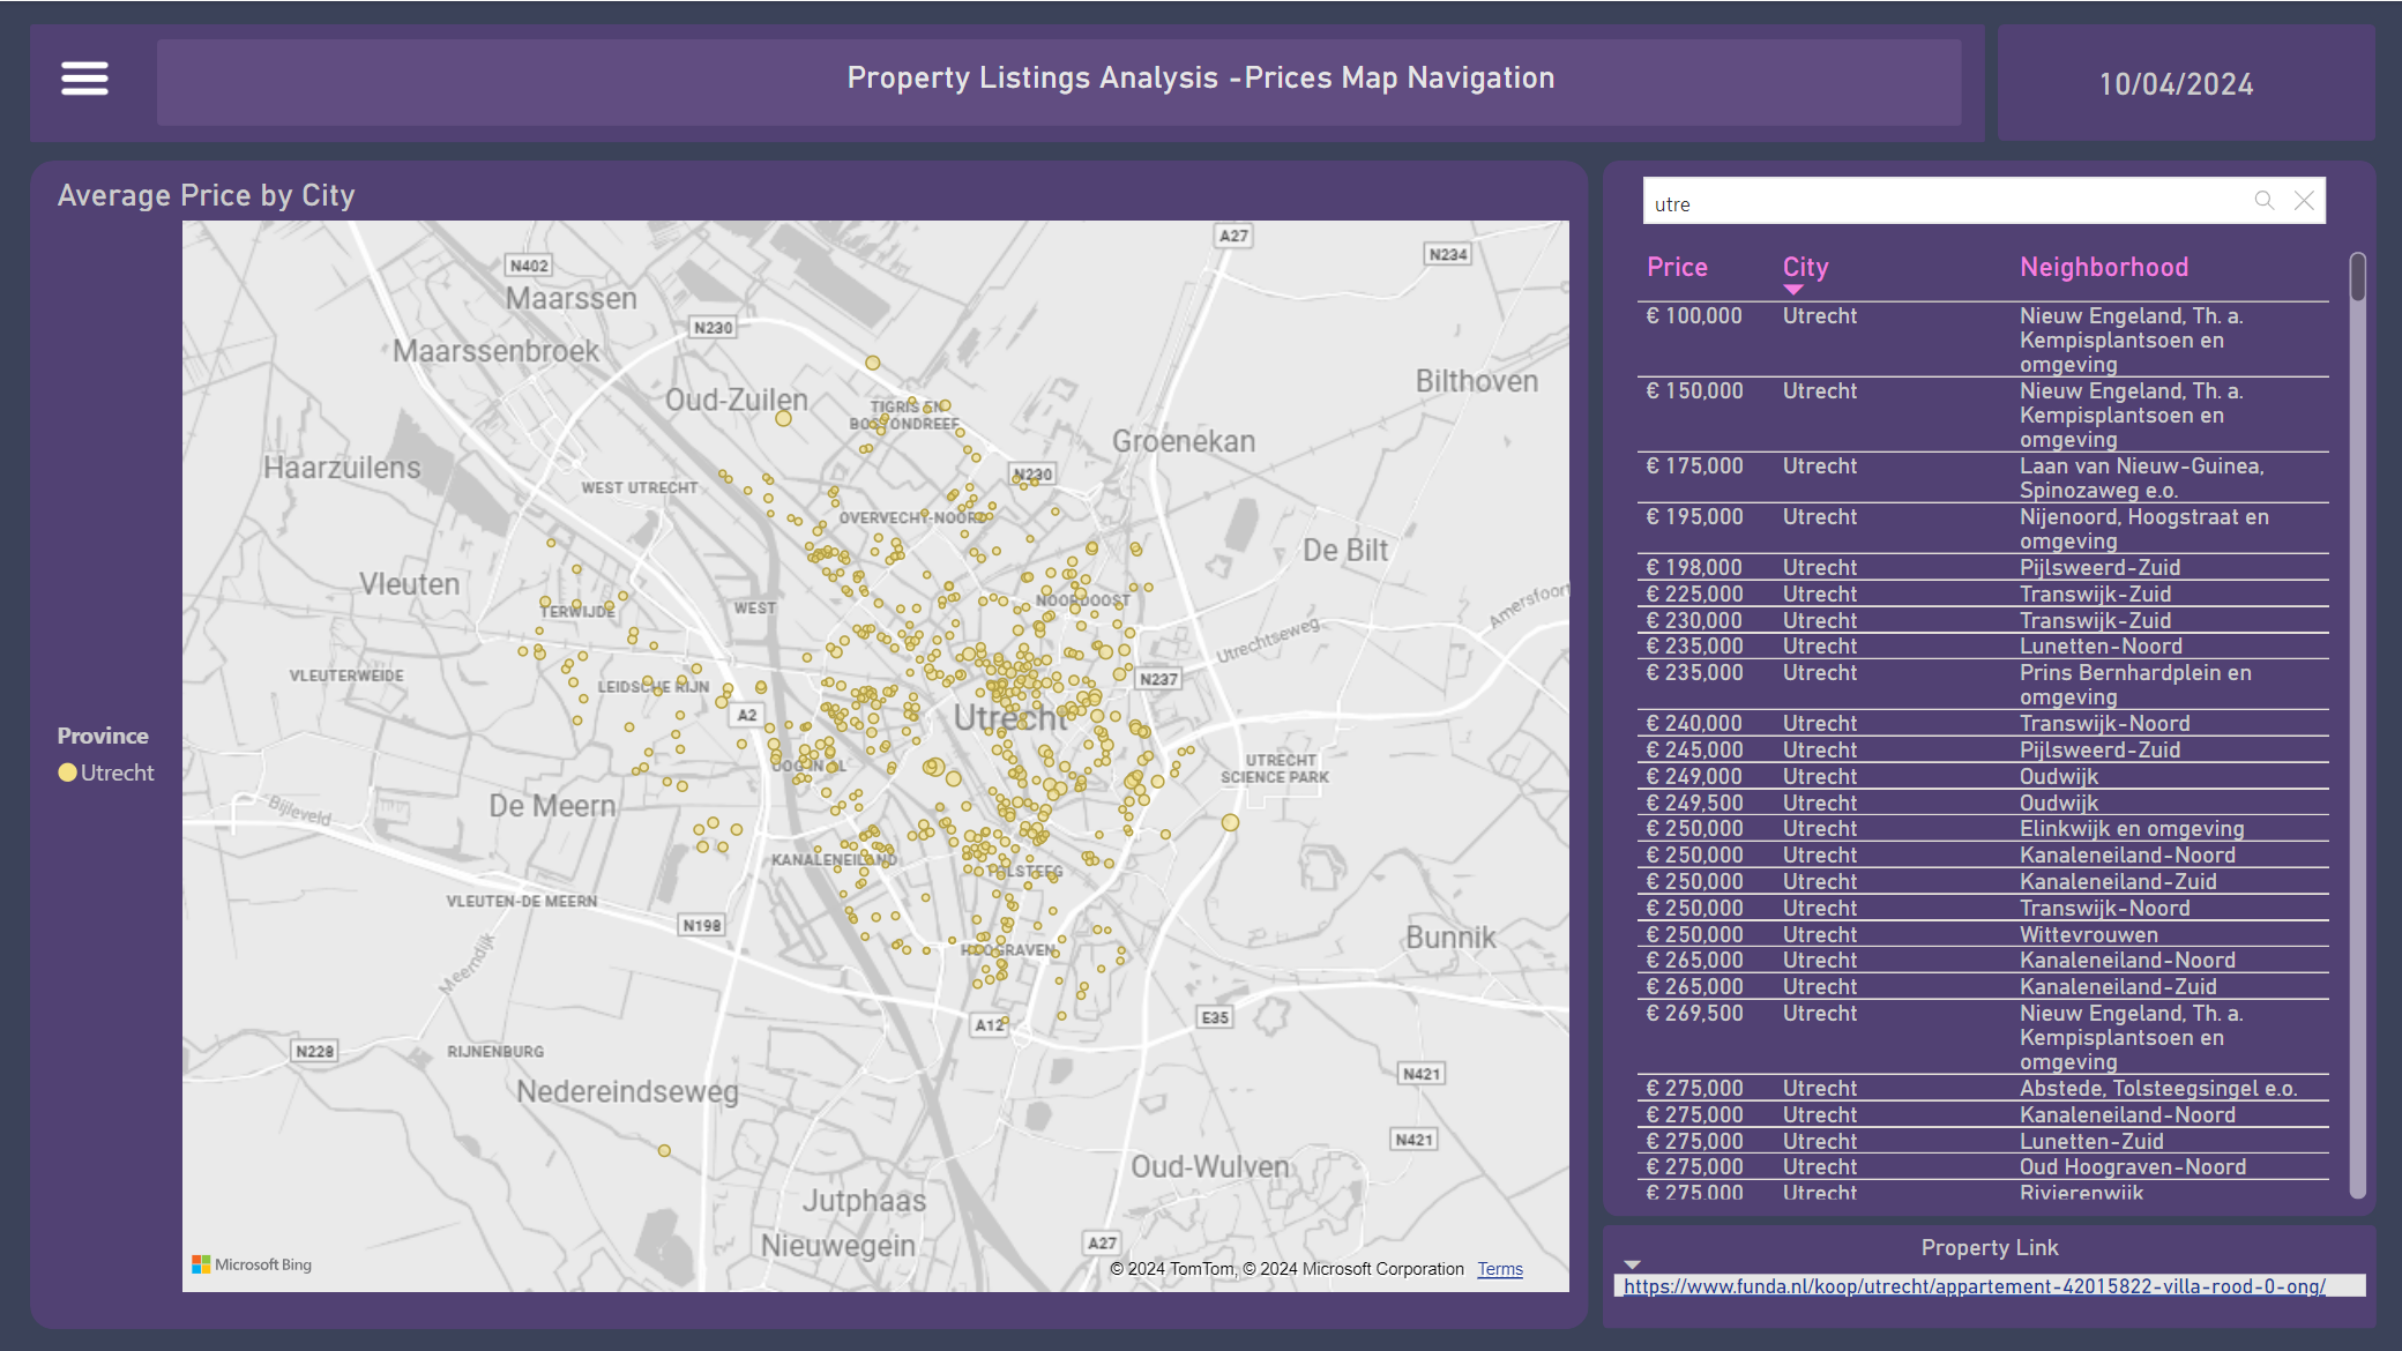
10. Prices Map Navigation
In the last dashboard, there is a bubble map with a size scaler relative to the property price. With a more open zoom, it is possible to see the country with province labels divided by colors, and also use them for filtering. Once filtered to a smaller granularity, such as by city, the bubbles will become more visible, and it is possible to identify the cheapest to most expensive properties.
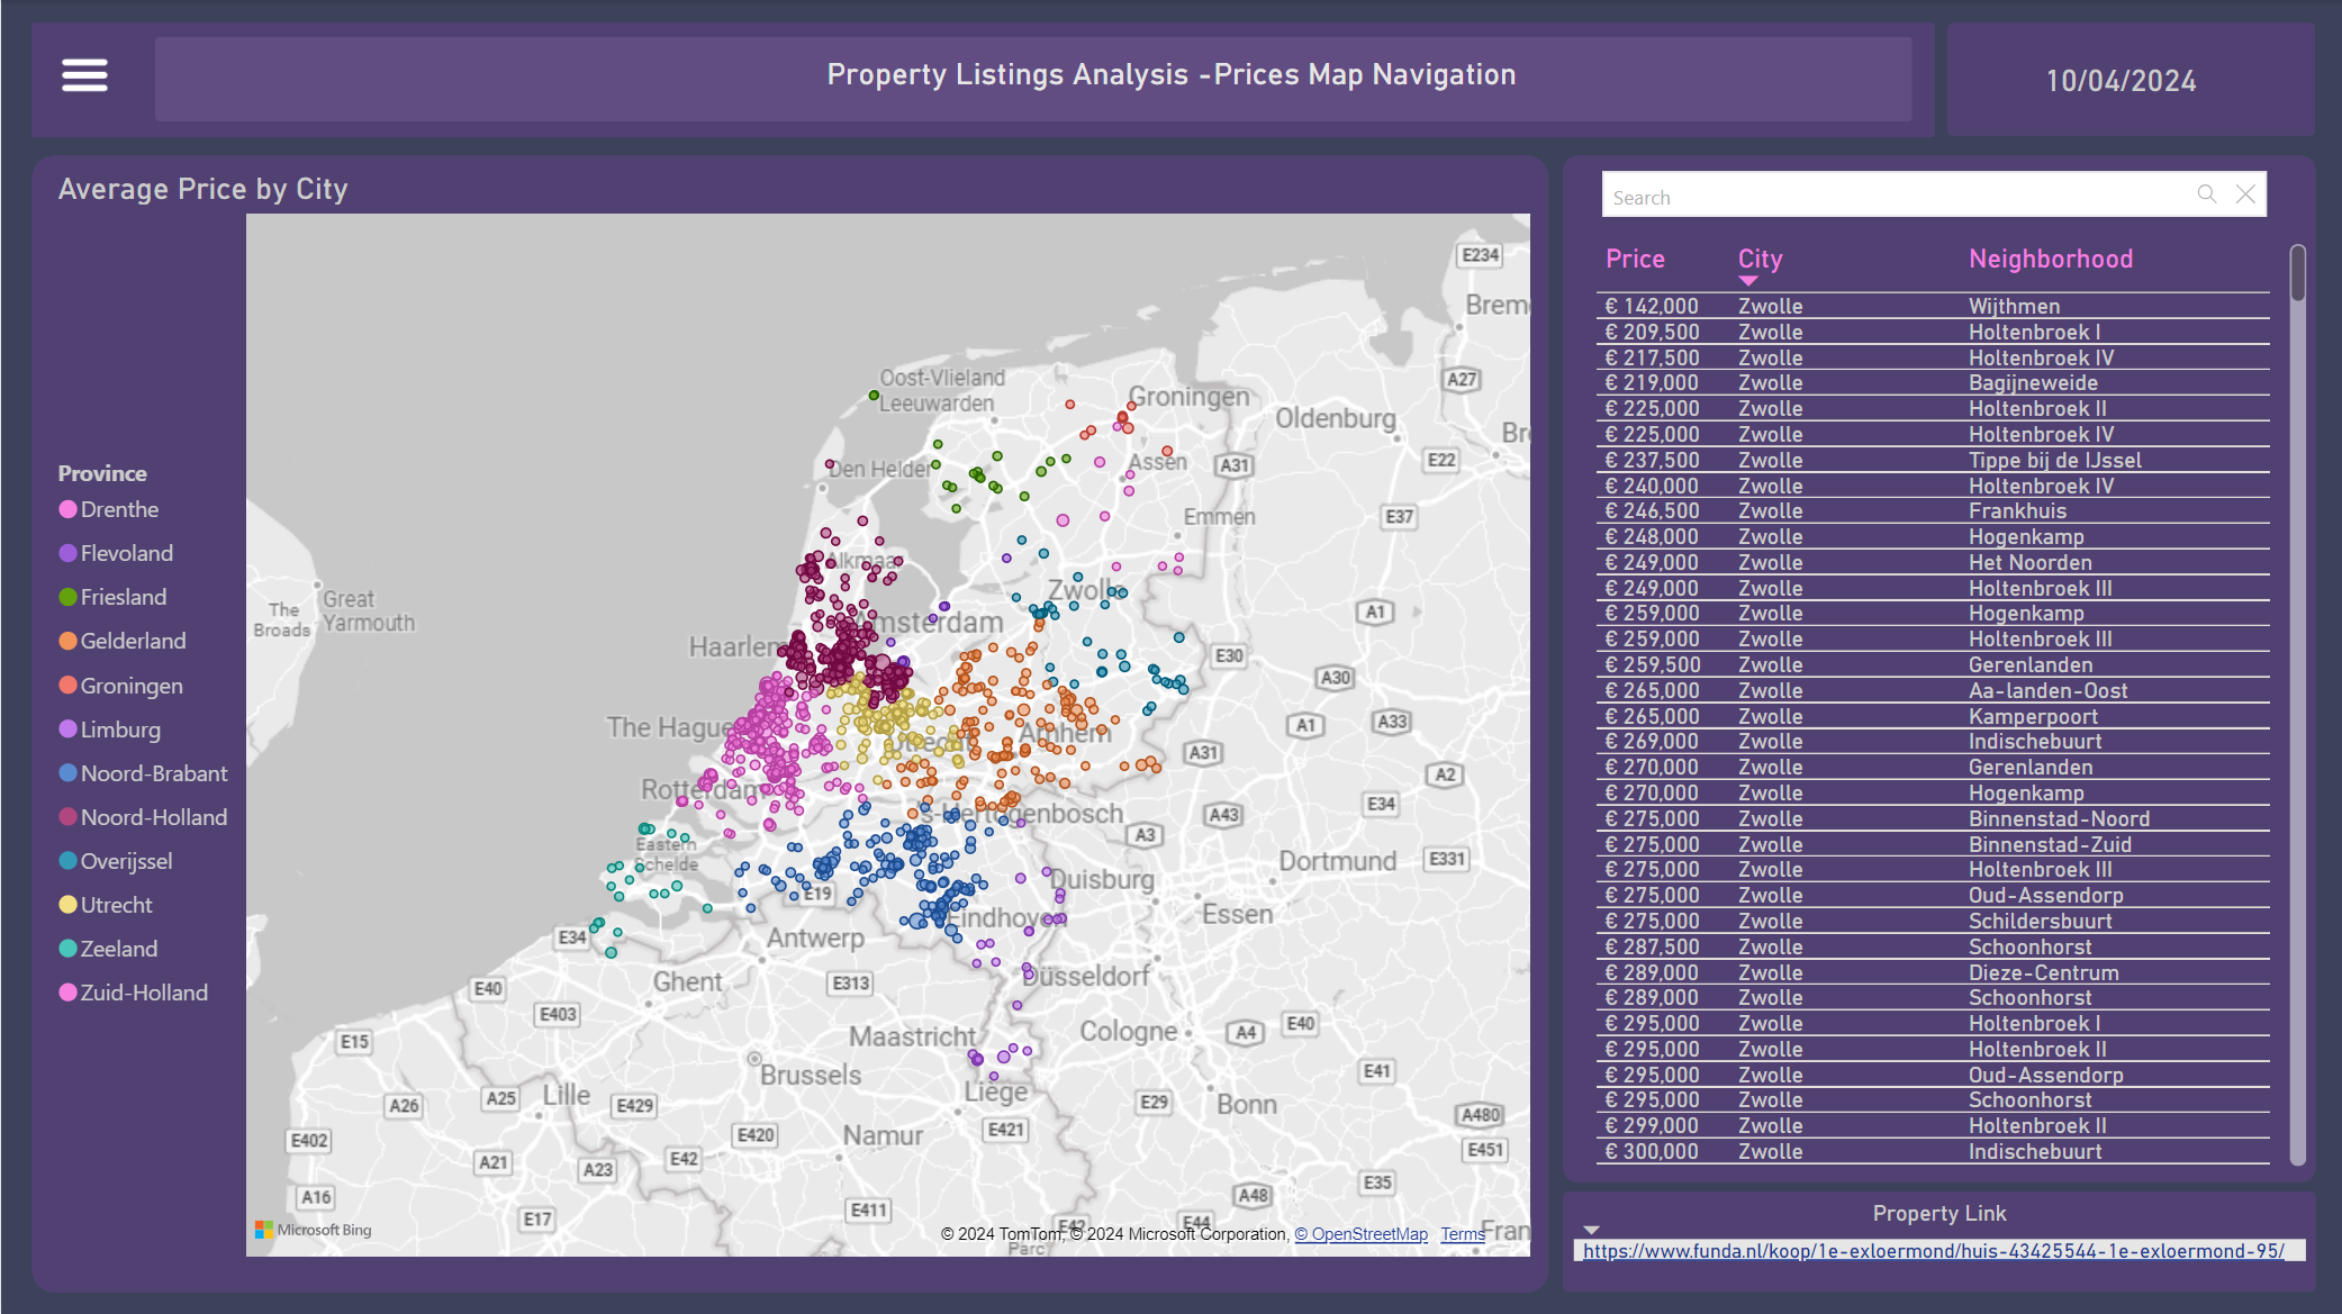
Both through the zoom and the table next to it, it is also possible to navigate through the neighborhoods, select a property, and open the URL referring to it, which appears in the bottom left corner, as shown in the figure.
Challenges and Limitations
Possible limitations of this project:
- Data update: The extraction and processing procedures can take days, making it difficult to keep the dashboard up to date. Thus, this project represents a snapshot of the day the data was extracted.
- Accessibility and interactivity: To progress from the status of a case study to a functional tool, a license for Microsoft Power BI would also be needed to allow the report to be published and to utilize all its interactivity features.
- Heat Map: The fact that the Heat Map does not load more than 30,000 entries limits the visibility of all points.
Report’s Video
In the Report’s video it’s possible to better see interactive visualizations.
Possible extensions:
The Funda Scraper allows the scraping of past data, meaning a history of listings with properties that have also been sold, not just those currently on the market. With this data, it would be possible to perform a temporal analysis of the market, extract patterns, and make predictions, which would be a very interesting extension for this project.